

It was just last week, the pair stalled at the 100 day MA
The USDJPY last week tested the 100 day MA (blue line in the chart below). The low reached 108.10.
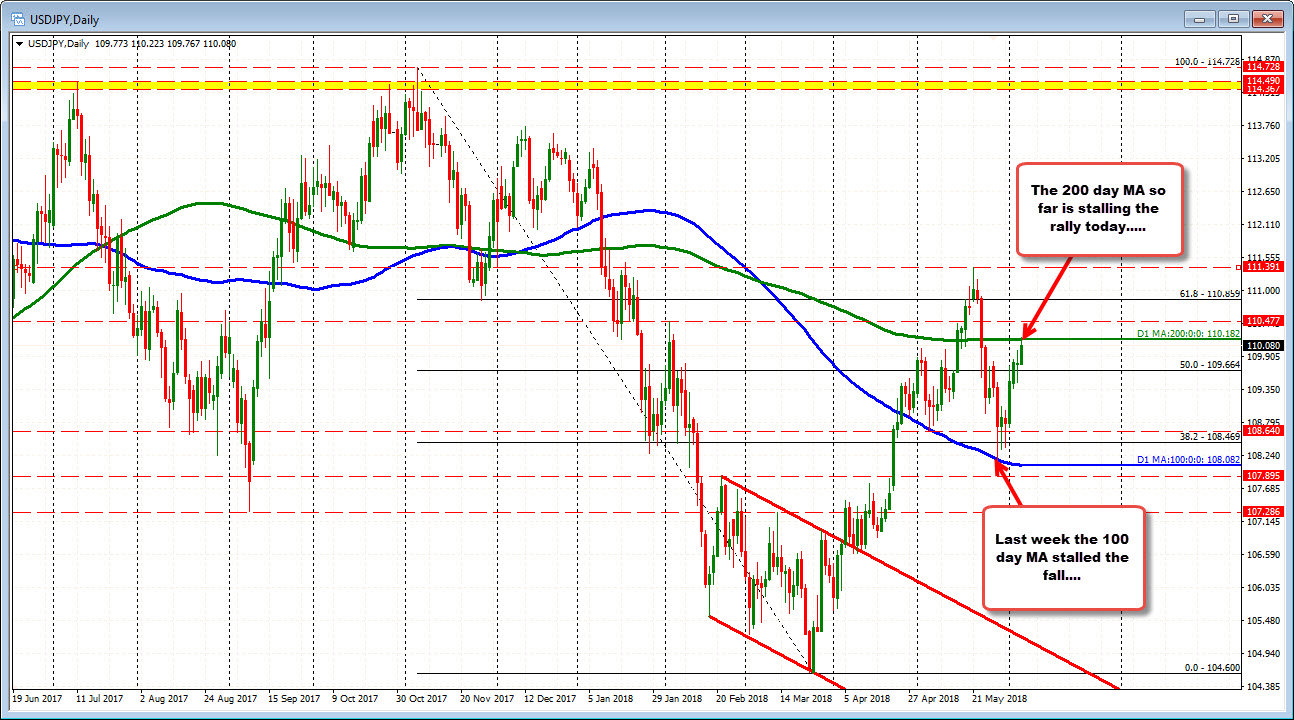
Today - 7 days later - the price has moved up to test the 200 day MA (green line) at 110.182 (the high reached 110.22). The price has backed off a bit from the key level. The price currently trades at 110.09.
A move above the 200 day MA would be more bullish with the February high at 110.477 would be a target on a break (from the daily chart).
Drilling down to the hourly chart, the pair traded above and below the 100 bar MA on the 4-hour chart at 109.859 (blue line in the chart below). Today, in the Asian session, the price traded above and below the MA line (blue line in the chart below) before marching higher as Europe came in.
IN addition, yesterday the pair stalled at the 200 bar MA on the 4-hour chart (green line in the chart below). That was the 2nd successful test (the level held on Monday too) and gave the buyers the go ahead to take the price higher (and discouraged the shorts).

The 200 day MA is a key technical level. Traders have to respect the MA and today they have so far. With the level finding sellers/profit takers, it does balance the buyers and sellers a bit. A battle is on.
On a correction, however, I would look toward the 100 bar MA on the 4-hour chart (blue line at 109.858) to attract buyers. Understand that sellers from above will be eyeing that level. Buyers will be eyeing that level too. It is key.