Société Générale technical analysis from a multi-year dimension down to the daily chart
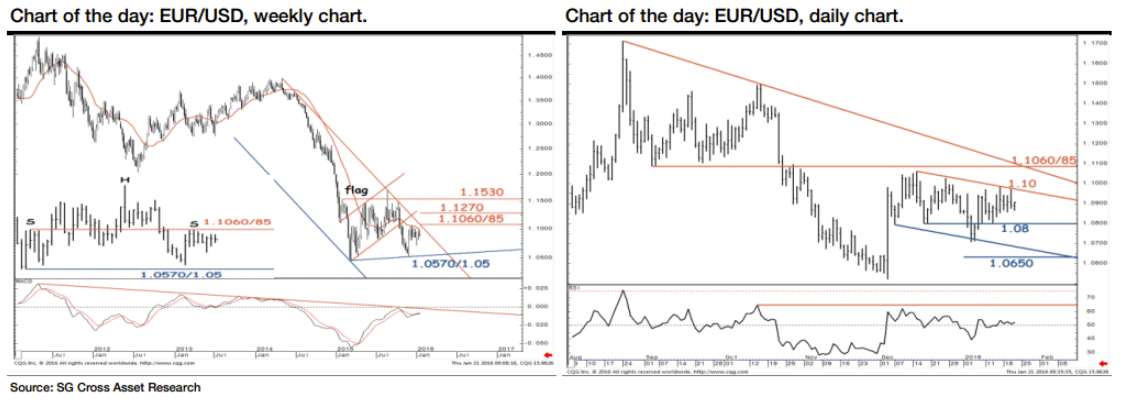
Having broken below the flag formation, EUR/USD retested last March lows and it continues to sustain below 20 week MA and more importantly below a multiyear descending channel limit at 1.1060/85, notes SocGen.
"It is noteworthy that this level also corresponds to the right
shoulder of a Head & Shoulders pattern. Weekly MACD indicator is
still languishing in negative territory which suggests possibility to
continue the downtrend. Thus, 1.1060/85 remains a key resistance and will decide if a larger rebound takes shape," SocGen adds.
"If we drop down to daily chart, the pair is undergoing a choppy down
move within a mildly descending channel. Channel limit at 1.10 is an
immediate resistance.
A clear break below December lows of 1.08 will indicate possibility
to test 1.0650 and even the neckline of the aforementioned pattern at
1.0570/1.05, SocGen argues.
Turning to GBP/AUD, SocGen notes that after testing the lower
limit of a multiyear channel (2.00), GBP/AUD has showed some signs of a
recovery.
"At 2.00, it has also completed the 23.6% retracement from 2013 lows.
Monthly RSI is hitting a graphical support highlighting 2.00 as a key
level. Formation of a weekly bullish engulfing pattern at that level
gives further credence to the support.
On daily chart, recent consolidation appears to be tracing a probable inverted H&S with neckline at 2.10. With daily indicator at support, a recovery is more likely initially towards 2.10.
A break above will lead to extension in up move towards 2.14/2.17, the 61.8% retracement from August highs," SocGen projects.