
Stays above support
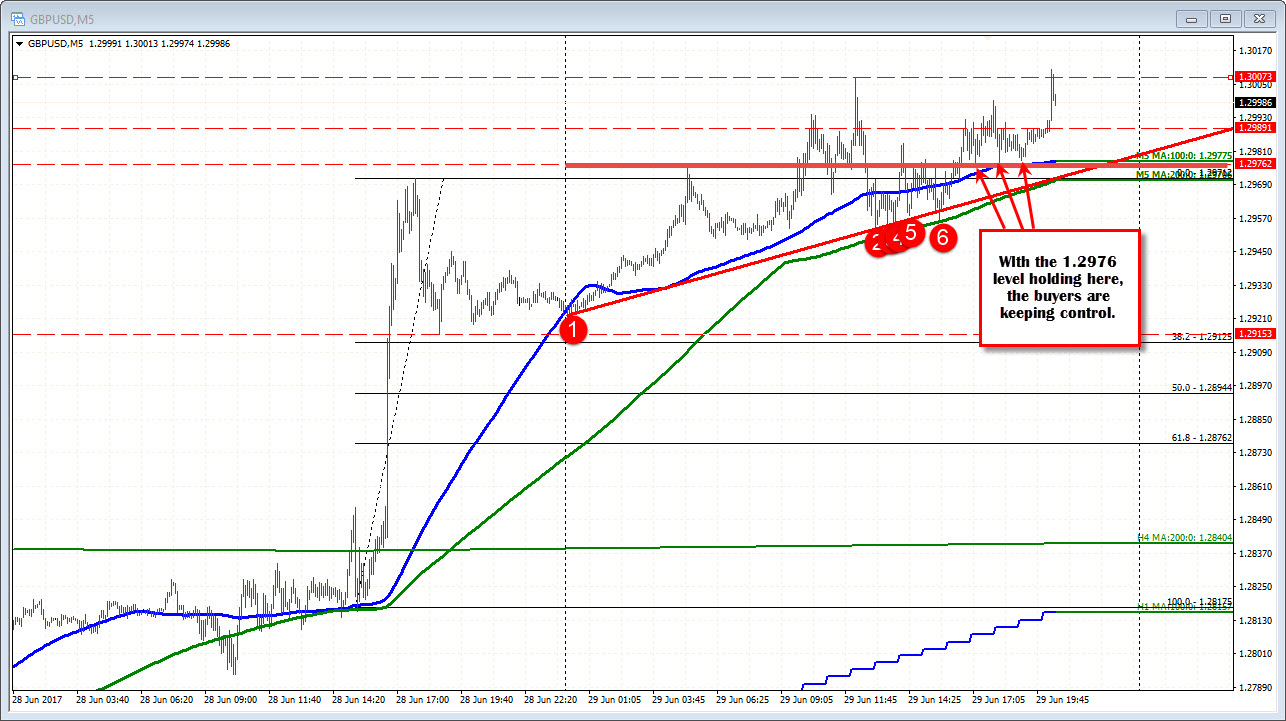
As per the prior post, the 1.2976-89 was a level of importance on the daily chart (click here to review post). Also in that post, I outlined the risk from the trend line and the 200 bar MA on the 5 minute chart (green line in the chart below).

What happened?
Looking at the 5-minute price action, the correction lower stalled just ahead of the 1.2976 level and has bounced higher. The price also stalled against the 100 bar MA (blue line). The 200 bar MA line (green line) and trend line were not even threatened. Buyers remain fully in control.
Holding above that support, has helped to push the GBPUSD to new session highs and once again away from the 1.2976-89 area (remains a risk level for longs/buyers). In addition, with the 100 bar MA holding the last low, that too is a risk defining level for longs.
Correction held above support intraday.
A key area on the daily chart has been broken.
The buyers are winning. The sellers are not.
The high close for 2017 is 1.30277.
The high for 2017 is 1.3047. Those are the next targets.
