
Stocks trading at the lows. Looking to test 2100 and 50% retracement at 2092 area
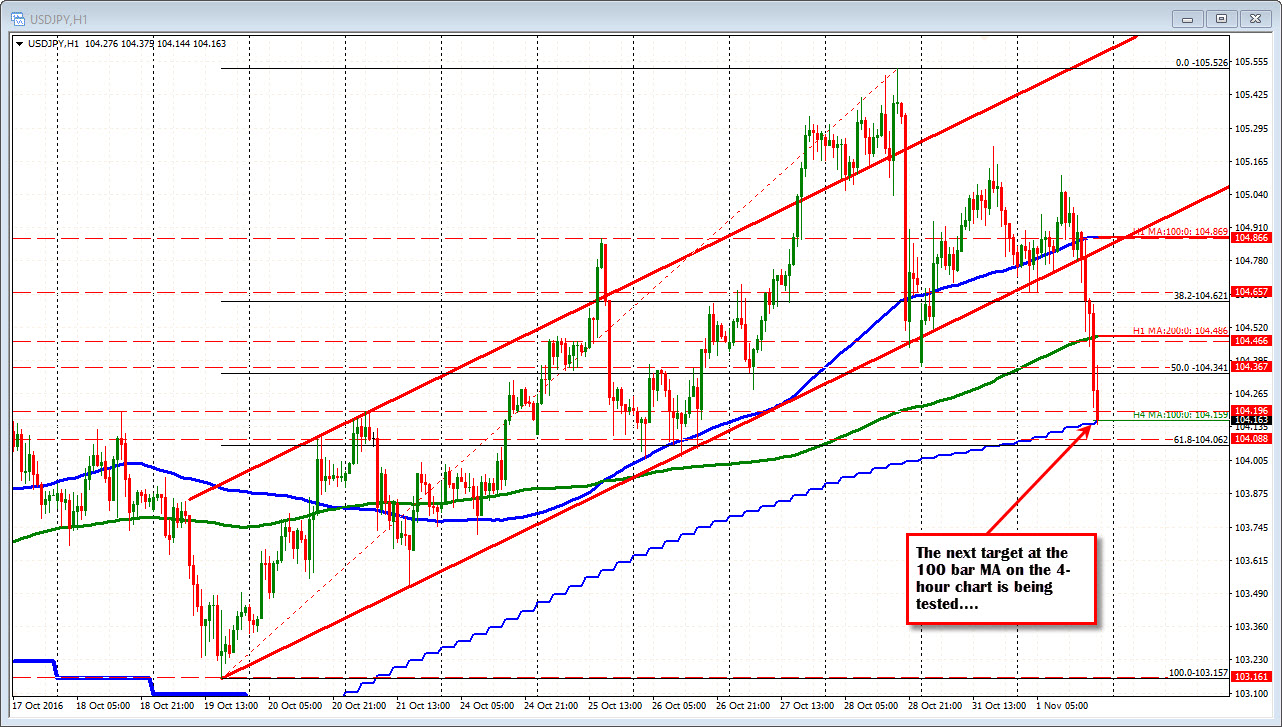
The USDJPY is trading at the 100 bar MA on the 4-hour chart (the next target) at 104.159. A move below that support will look toward 104.00. Last Wednesday, the lows came in just above the 104.00 level. The 61.8% of the move up from the October 19th low comes in at 104.06. The pair continues to step lower and lower..

The move lower in the USDJPY is being helped by selling in the US stocks. The S&P index is trading at session lows and moves further away from the 100 day MA at 2144.89. The next major target on the daily chart comes in at the 200 day MA down at 2179.96.

Closer support comes in at the nice round number at 2100 and then the 50% of the move up from the June low (see 4-hour chart below). That level comes in at 2092.77.

The Nasdaq is also getting hit (down -1.10%) and the Dow is down 140 points or -0.77%.
Things started to go south in stocks at around the time more concerns about Clinton emails started its rumble in the market (see Adam's post here). Whatever happens on November 8th, between now and then, the market is likely to trade with a lot of nervousness. How could it not with all the back and forth going on? The Pavlovian reaction is sell stocks, buy gold (spot gold is up 1.01%) and for whatever reason, buy JPY (and CHF too).