
Yesterday moved higher and consolidated. Today, that bullish idea faded.
YESTERDAY, the USDJPY moved higher, reached the 50% of the move down from the Feb high (see chart below), corrected lower and held the 100 hour MA on the correction. The pair ended yesterday nearer the high as it headed into the new day (that would be today).
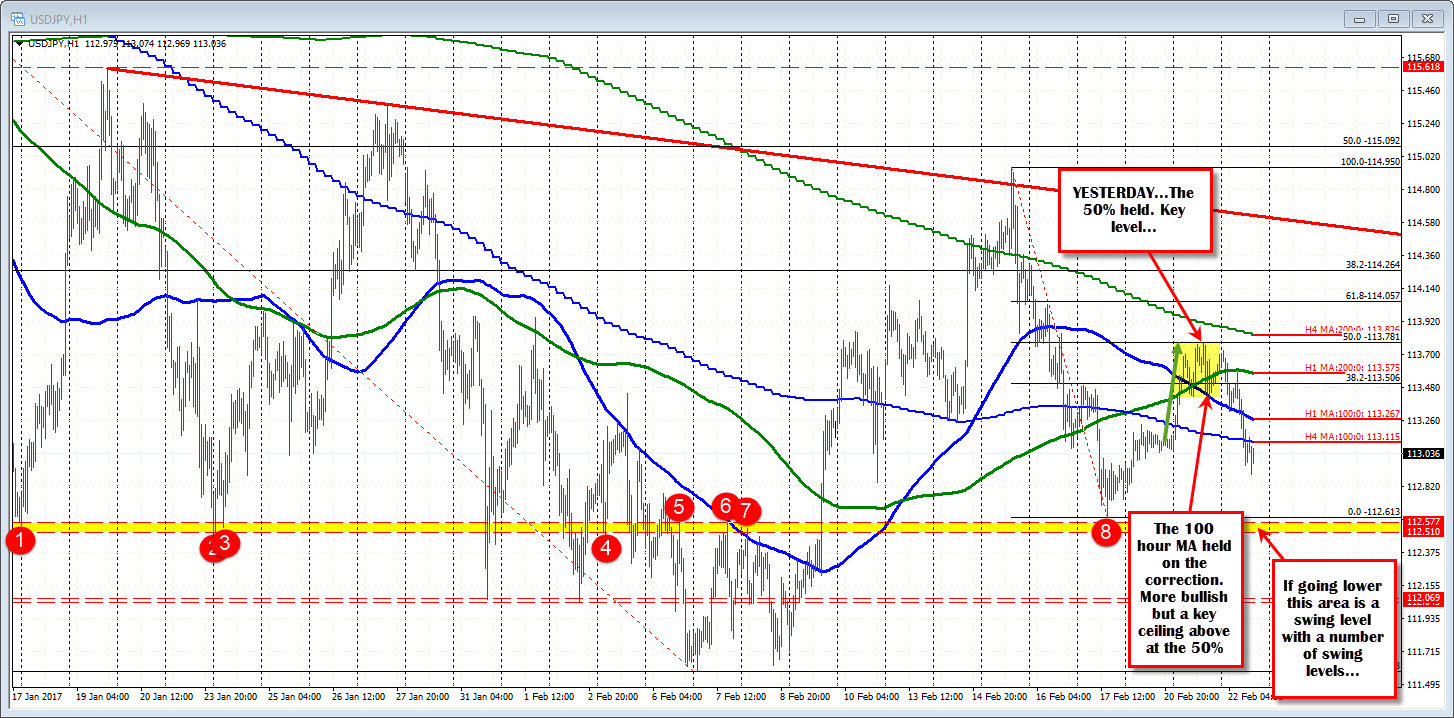
Today, the price started above it's 200 hour MA (green line in the chart below at 113.576 - it is easier to see but it is the same hourly chart). The price of the USDJPY fell below that MA, tested the 100 hour MA (blue line), retested the 200 hour MA (see light yellow circle). The buyers finally gave up and the price fell below the 100 hour MA. Longs gave up/sellers took back control.

The London session today saw the price move from the 100 hour MA at 113.31 (at the time. It is now 113.268), to the low of the day at 112.90. In the process, the pairs price moved below the 100 bar MA on the 4-hour chart at 113.115. That MA seems to be an area that sellers are trying to lean against now. Shorts want to see the price stay below to keep the step down trade progression in place.
So the 113.11 is close risk now, what about the downside?
The low for the day is as good a level to get below. Below that the 112.51-58 has been home to a number of swing levels going back to mid January (see the red circles in the char at the top). We traded below that area in Feb - and tried to stay below (especially on Feb 7/8), but could not. The Low last week stalled just above that area at 112.61.
Stocks are opening down. We will see what happens. Does the sellers keep in control or do the sellers turn to buyers?