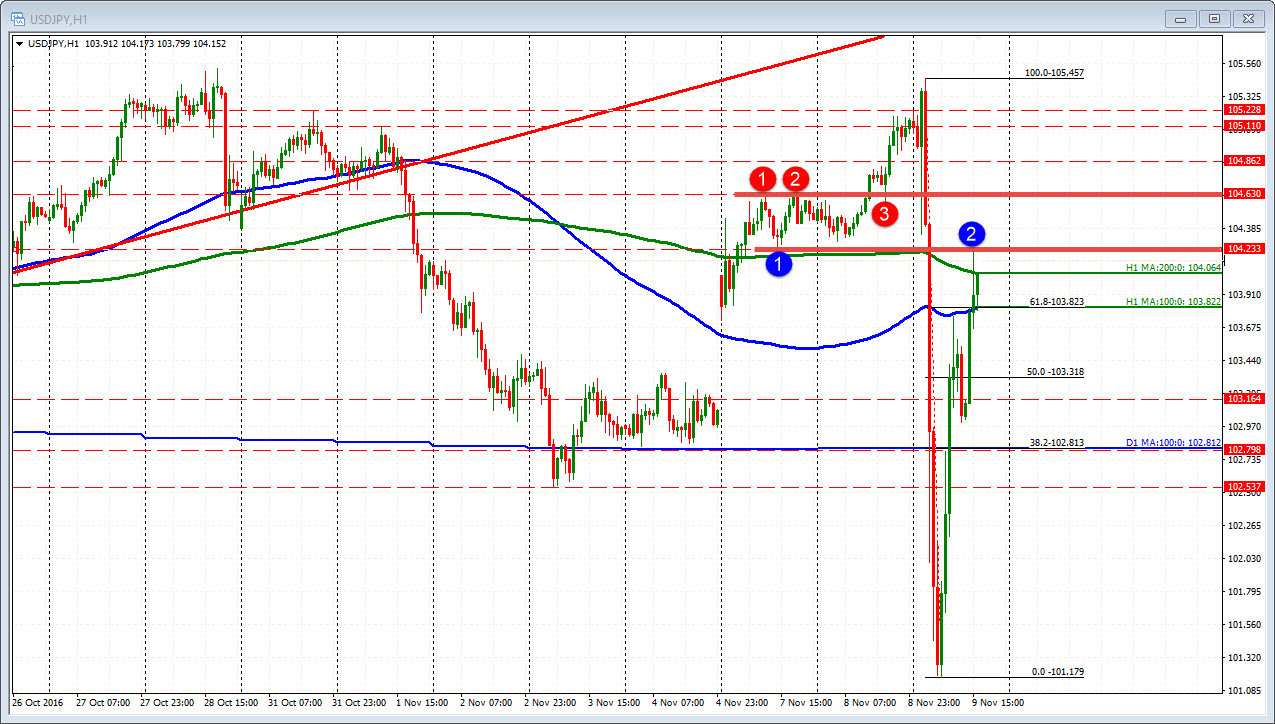
The price is back in the middle of the month long range
When you get these big moves in a day, the market can tend to ignore the technicals. I like the 100/200 bar MAs. I like retracements and trend lines. I like them, because the market tends to pay attention to them as a way to define risk and limit risk and with that, the bullish or bearish bias.
In wild markets, it might be more flows, but the "market" will look to latch back on.
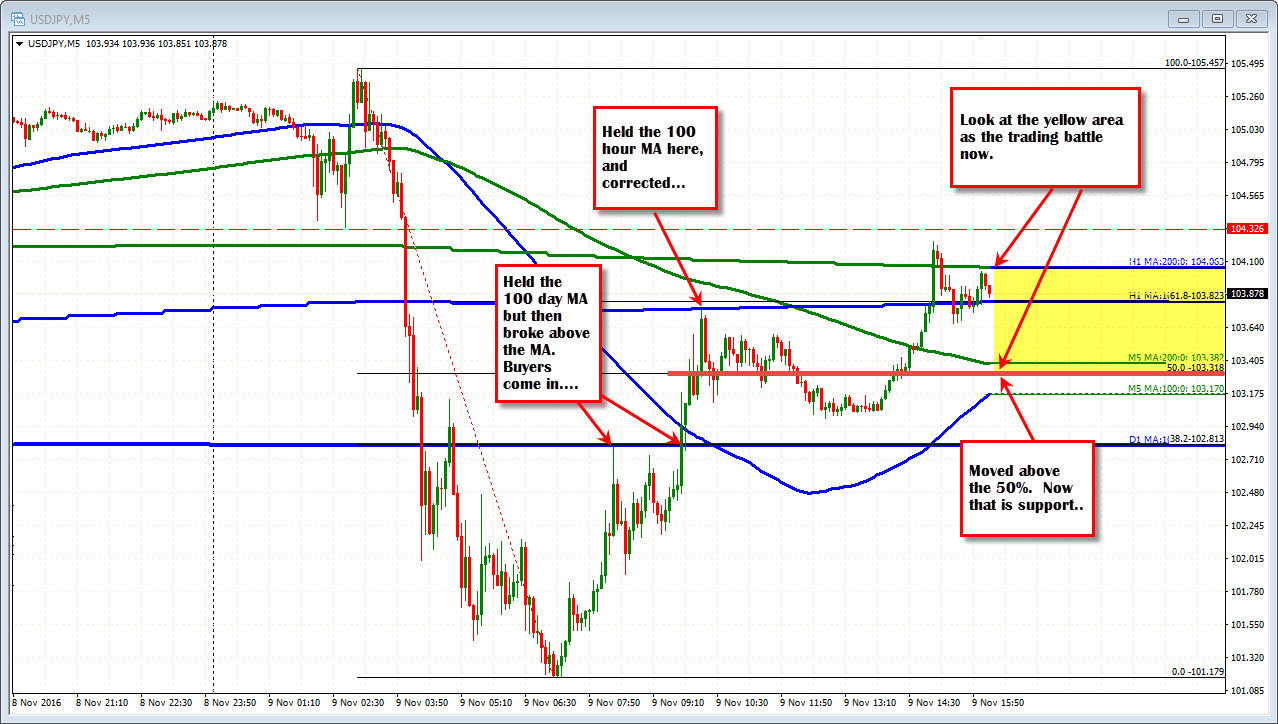
Looking at the 5 minute chart, I have the overlay of the 100 and 200 hour MA and the 100 day MA (the 200 day MA is out of the picture).
The tumble lower, which was 428 or so pips, it took the price to a low of 101.179. Honestly, there was nothing special technically about the low. It was short of the 100.58 level which was the 50% of the move up from the 2011 low and the 100.00 level.
Once the low was established, however, the tools can be applied to see how the price reacts. What happened and where are we now?
The first bounce stalled at the 38.2% and the 100 day MA at 102.813. The market respected that technical level. That level comes in at 102.813. A lid was on, but when that was broken, the bias turned around. The sellers turned to buyers and the price moved higher (see chart above)
Where did the price go after breaking back above the 100 day MA?
It went right up to the 100 hour MA at the 103.82 area, and stalled again. Support now against the 100 day MA (at 102.813, and resistance at the 100 hour MA at 103.82. The price corrected above and below the 50% midpoint, but over the last few hours has been trading above the 50% of the day's range at 103.318. That is a support level now intraday.
Now what?
The price has moved above the 100 hour MA at 103.823. That is not far from the 200 hour MA at 104.063. It seems the market would pay attention to that area - and the market is hangin around the 100 and 200 hour MAs. ON a dip, look for the 50% to look to hold support. The 200 bar MA and the 100 bar MA on the 5-minute chart are both near that area too (green and blue smooth lines at 103.28 and 103.17 respectively).
Of course the stock market will be an influence (or should be). That may be a catalyst for a break higher (on a rebound) or a break lower (on a sell off). We will see.
Traders may put the technicals aside when the market is fast and furious, but then moves back to defining and limiting risk against levels. In the 428 pip trading range, we saw that in the USDJPY today. Look for the lean levels to lean.
PS on a break higher the next target is 104.23 and the 104.63 (see hourly chart below).
ON a move below the 50% below, we will look toward that 100 day MA again at 102.813.