
BOC on Wednesday
Looking at the daily chart of the USDCAD, the pair has had it's share of both green (up) and red (down) days with a variety of little spurts higher, and similar falls over the last month or so of trading.
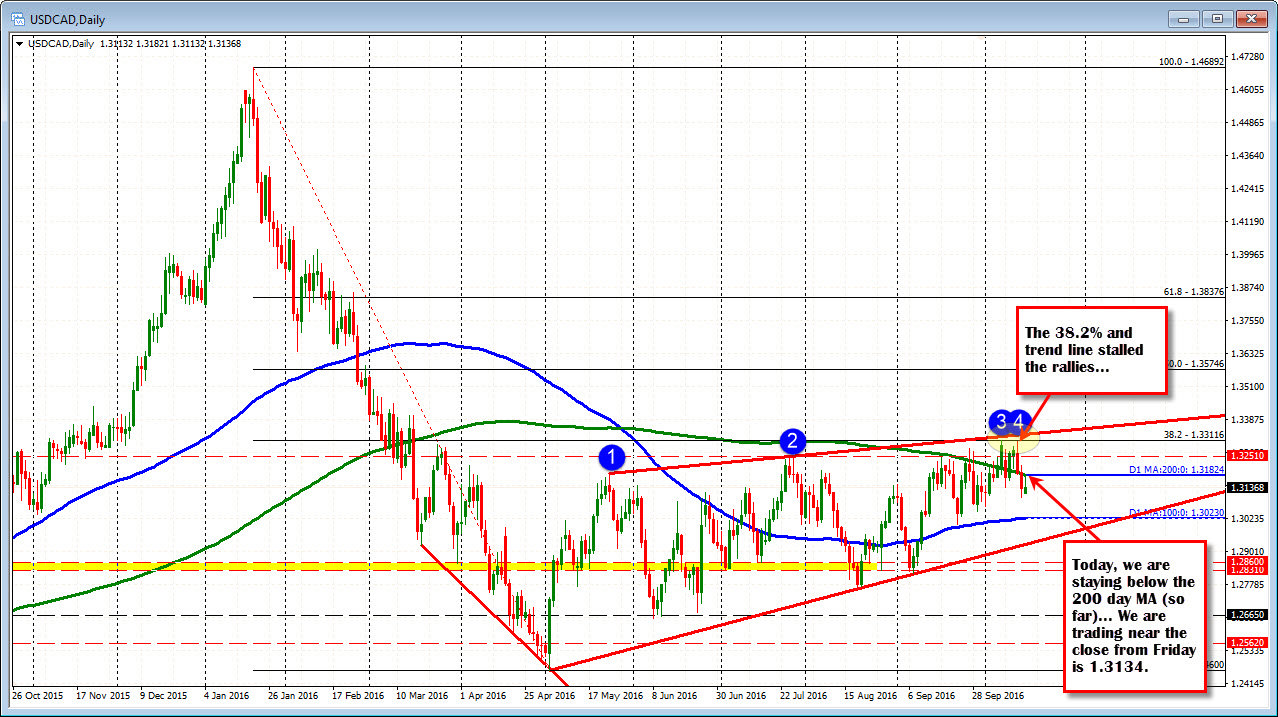
The last few days has seen more selling with the pair falling from the 38.2% retracement and trend line resistance (see chart above). Today, the price rallied higher but stalled right at the 100 day MA at 1.31824. HMMMM. Sellers leaned. A bearish clue.
The price is down off of that peak and near the closing level from Friday at 1.3134. The swing low from October 10th is at 1.3138 as well. Looking at the 5-minute chart below, the pair has been trading up and down in the North American session. The correction off the low has stalled between the 38.2-50% of the range today. The low has dipped below the 200 hour MA on the 4-hour chart (overlay marked H4 MA:200...in the chart below), but rebounded qucikly. Oil prices are down below the $50 level to $49.64, down 1.37% (-$0.62). That should be supportive to the price but the reaction has been limited..

The holding of the 200 day MA on the topside was a telling move. Will that lead to follow through action though? Getting below the close and then the 200 bar MA on the 4-hour (and staying below) will be eyed now. After that, traders may look toward the 100 day MA at 1.3023 over time. What would spoil that story? Moving and staying above the 1.3050 area would not be an encouraging development. Action is really quiet....
PS the BOC meets on Wednesday. They are expecting to keep rates unchanged.