
GDP MoM +0.4% vs +0.3%. RMPI surges by 6.5% (est 2.8%).
The USDCAD has moved to new session lows after GDP for the month of November increased by +0.4% for the month. Also the Raw Material prices surged by 6.5%. It may be transitory but it catches the markets attention. The US employment cost index was also a bit light at +0.5% vs 0.6% est.
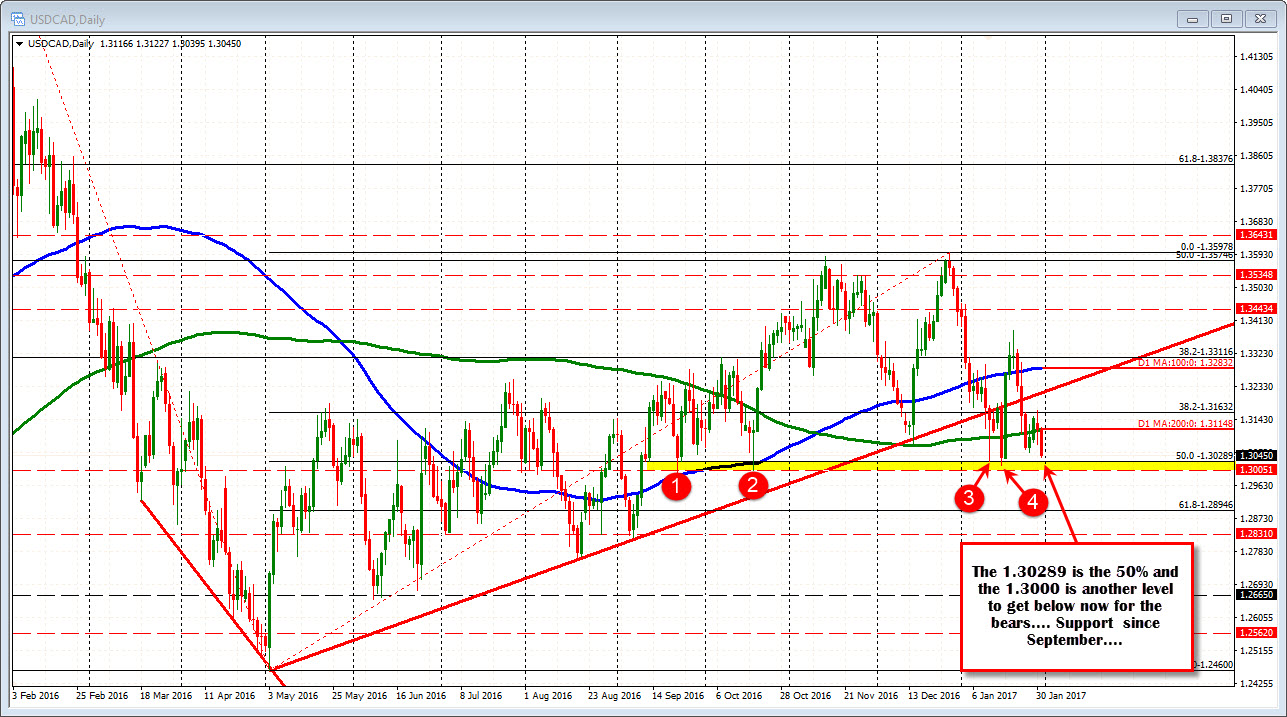
The USDCAD has moved to new session lows and looks toward the 50% of the move up from the May 2016 low at 1.30289. Earlier in the month the pair tested that MA line on two separate occasions (lows at 1.3028 and 1.3017). The low just reached 1.3040.
The price for the USDCAD has been trading above and below the 200 day MA over the last 5 trading days (green line in the chart above). Today the price peaked just above that MA line (high reached 1.3121 with the MA at 1.31148). We are moving more away from the MA line now. That is more bearish, but we need to see a break below the next target(s) to confirm the move more.
The sellers now want to now see the price get below that 50% level and stay below that technical target. The low from October at 1.3000 will also be eyed on a break of the 50%. Of course a"big figure" tends to stall falls (may be some option stuff there too). However, if the sellers are in control (and want to push away), a move below that level should open the door for more declines (if can stay below 1.3000).