
Crude oil back above $51.00
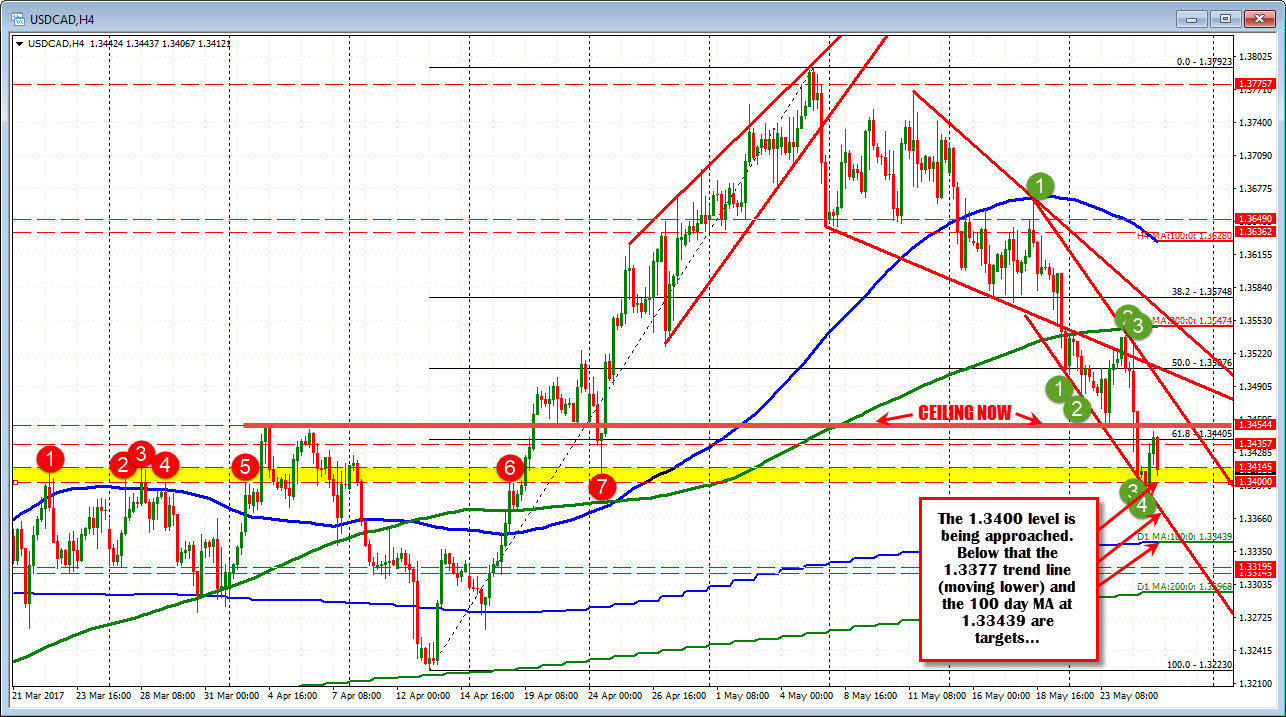
The USDCAD is down in the 1.3400-14 area. That area corresponds with a number of swing highs/lows (see red circles on the 4-hour chart above). The price moved below that area in earlier trading today, but stalled at the channel trend line. That trend line comes in at 1.3377 currently and moving lower. If going lower, that trend line will be eyed along with the 100 day MA at 1.3344.
ON the topside, the 1.3454 is a key level on this chart to stay below (and gives more of a bearish bias). That level was a ceiling back in early April (see thick red line). Moving forward, the price moved above on April 19th . ON the 24th, there was a move back below, but that break faded fairly quickly. Earlier this week, the price stalled at the level. Today the high reached 1.3448. It is now a ceiling for traders. Stay below and the shorts are more in control.
OPEC has agreed to a 9 month extension of production. The price of Crude oil has traded with a low of $50.08 and a high of $52.00. The 100 day MA is at $51.04 - right between those two levels. If we get a break one way or the other in oil, the CAD should follow along with it.
