
Comes in at +1.5% vs +0.5% estimate
The USDCAD has moved lower after the better-than-expected wholesale trade sales. They came in at 1.5% versus 0.5%. The program offers revised to -1.1% versus -1.2% previously reported.

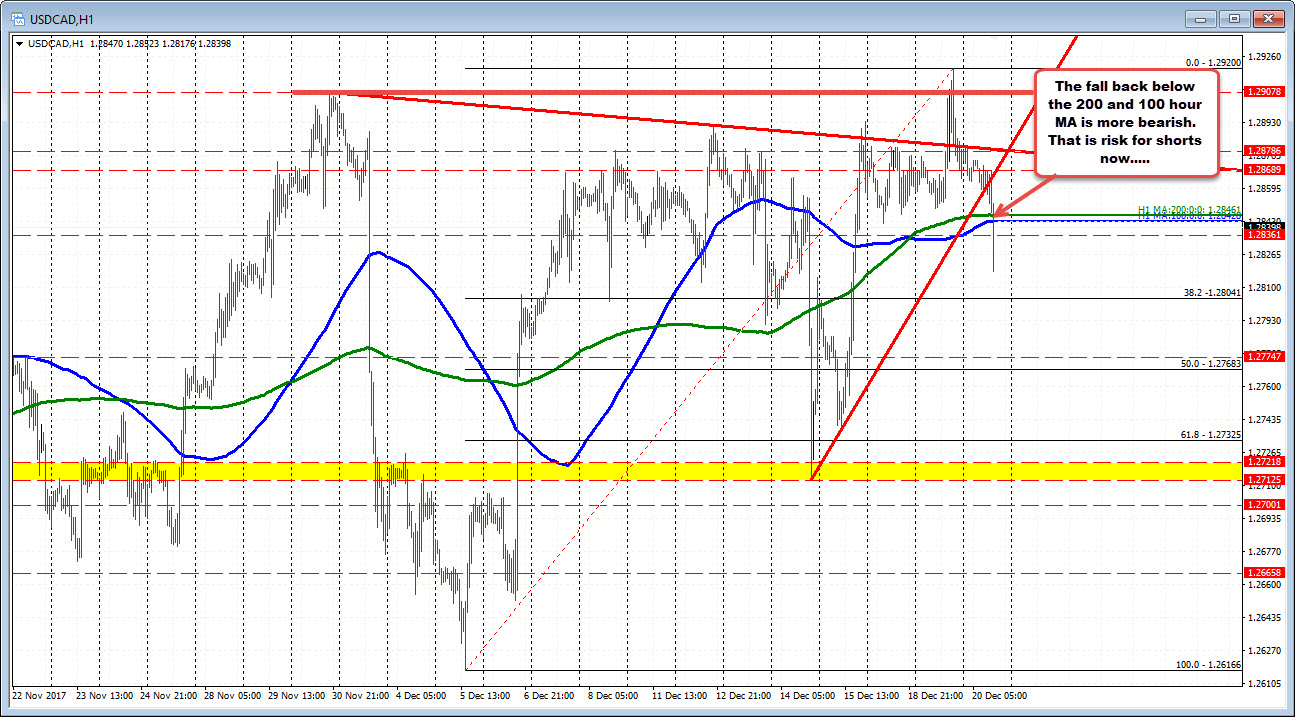
Technically, the USDCAD has moved below its near converged 100 and 200 hour MAs . The MAs are at 1.2843 and 1.2846 respectively. The break below is more bearish. Those moving averages are now risk for the shorts. The 38.2% retracement of the move up from the December low comes in at 1.2804. That is the next downside target.
Looking at the daily chart below, yesterday the USDCAD moved up to a high of 1.2920. That was the highest level since July 12. However, key resistance against the key to a new day moving average and 50% retracement of the 2017 trading range at 1.2927 stalled the rally. Risk could be defined and limited against those key technical levels (see chart below). The better numbers today, give sellers more about fundamental reason to buy the loonie (sell the USDCAD).
