
Got it's bearish legs after holding trend line and 200 hour MA yesterday.
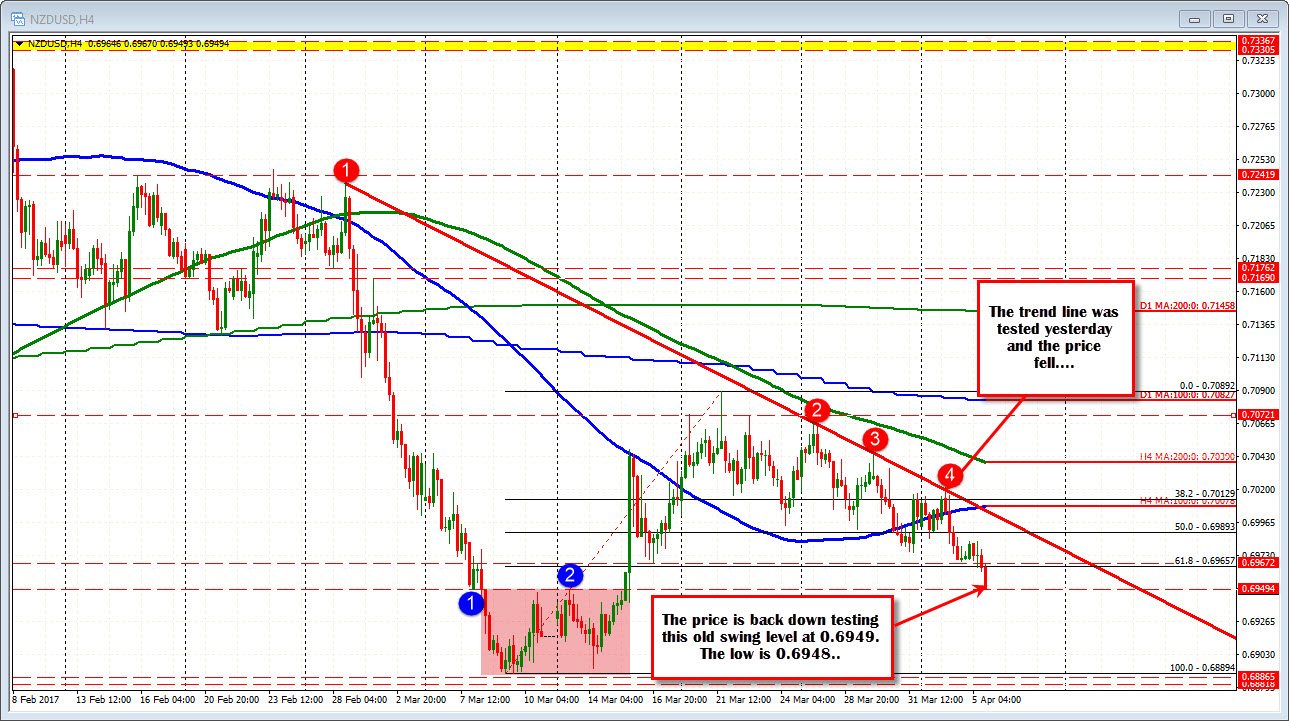
Yesterday, the NZDUSD tested a trend line on the 4-hour chart at the highs. That trend line connected highs from Feb 28th and March 27th. There have been two other tests since then including yesterday's test.
Looking at the hourly chart, the pair was also testing the 200 hour MA at the highs yesterday. Good level to sell. and the ball got rolling to the downside.
Today, the pair has moved to the lowest level since March 15th. The pair ahs moved below the 61.8% of the move up from the March low at 0.69657. That is risk now for shorts. The price is testing a support level defined by a swing low from March 8th and another swing high from March 13th at 0.6949. We also just moved below trend line support at 0.6954. A move below that area opens up the downside for further down side potential.
The current level is a support level to eye. When a lower trend line is broken, it is a sign that the market may be getting ahead of itself (oversold). So be more on alert, but the sellers are still in control.
