

A floor has a ceiling when the floor is a floor area....
The GBPUSD moved lower in trading this week On Monday, the pair was bumping against the 200 bar MA on the 4-hour chart. It stayed below (sellers leaning) and that helped to start the ball rolling to the downside (see the green line in the 4-hour chart below).

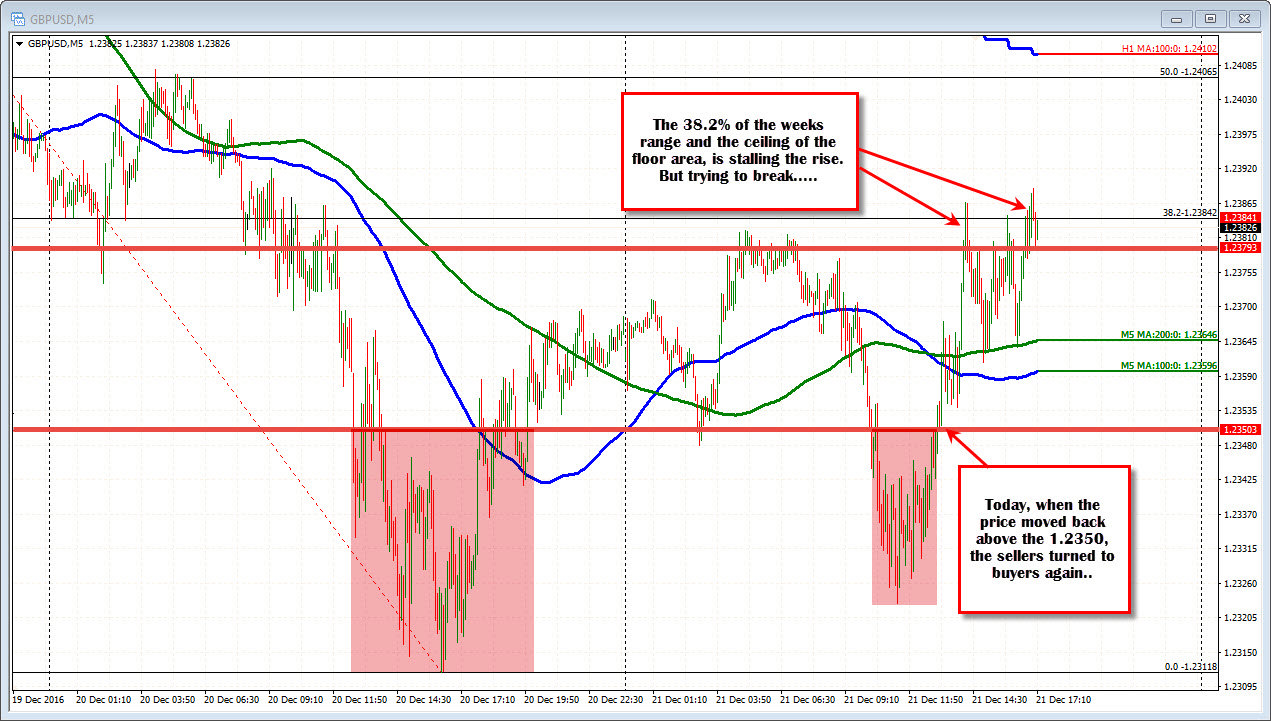
In trading yesterday and again today, the price decline saw the price fall below a floor area that has a number of swing lows going back to November 1. That area I have defined between 1.2350 and 1.2379 (yellow area in the chart above). The 38.2% of the weeks range is not far away from the ceiling of that floor area at 1.2384.
Now, the moves below the low of the floor area should have solicited more selling - that area is a key area. I would have expected that the break should have at least moved below the swing low from November 18th at 1.2300. However, it failed yesterday and again today - AND each of those lows were comfortably above the 1.2300 level (at 1.2311 and 1.23227 respectively).
So when the price moved back above the 1.2350 level today (the floor of the floor area), the buyers pushed higher.
We are now trading near the ceiling of the floor area (and around the 38.2% of the weeks trading range). Can the buyers from the 1.2350 level (and any other newer buyers) break the ceiling of the floor area and push it higher? That is the test and the battle being fought right now.
The existing home sales are not helping from a fundamental perspective as they came in a bit stronger than expectations but the dollar is not running. Do we stall or go higher?