
Seeing a stall
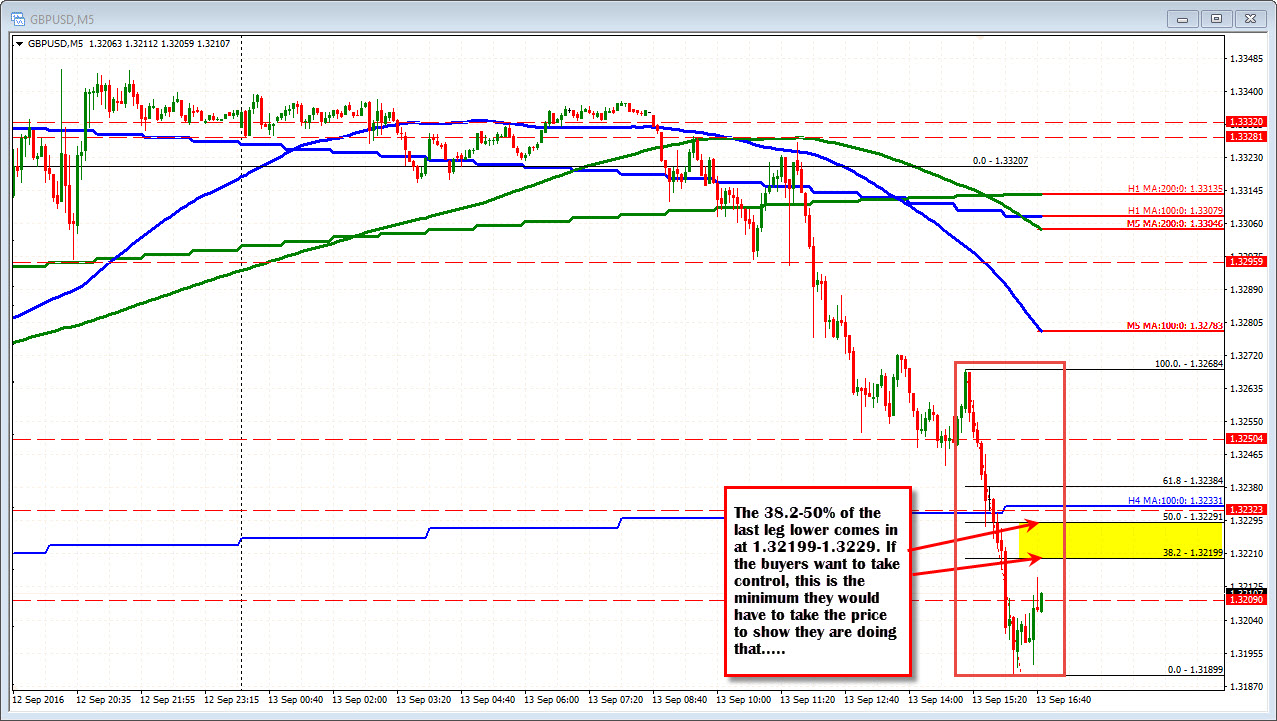
The GBPUSD tumbled in the early NY session with the pair moving from a high oaf 1.3268 to a low of 1.3189. The pair is seeing some consolidation and corrective action now with the price moving to a 1.3214 currently, but overhead resistance should hold if the selling was real.

Where might that come in?
The 1.32199 -1.3229 is the 38.2-50% correction zone of the move down from the last trend move lower. IN a trend market, sellers are taking control. They are overwhelming the buying (in the case of a move down). If those sellers are intent on being short, they will defend their posiition.
At the same time if the buyers are stronger at this level, they have to prove they can take back control.
I use the 38.2-50% of the last trend leg as a proxy for the minimum move that buyers would have to overcome to take control. If they cannot do that, they are not taking control. Moreover the seller are keeping control.
It is about control. in a trend-like market. There can be corrections, but if the correction are contained, the trend remains the same. Watch 1.3219-29 for clues. Stay below and the sellers remain in firm control.
Taking a broader view of the pair, the price of the GBPUSD has been consolidating between the 1.3532 and 1.2791 since Brexit. The September high peaked at 1.34439 - short of the post-Brexit high and below the July high at 1.34439. So there are lower highs.
SInce the low in August (which was above the July lows - so higher highs), the pair has seen a trend higher with an up and down moves higher.
Today, the pairs price moved below the 38.2% of the move up from August at 1.32227 and also below the trend line at 1.32187 today. That area should also act as resistance if the sellers are to remain in control.
