
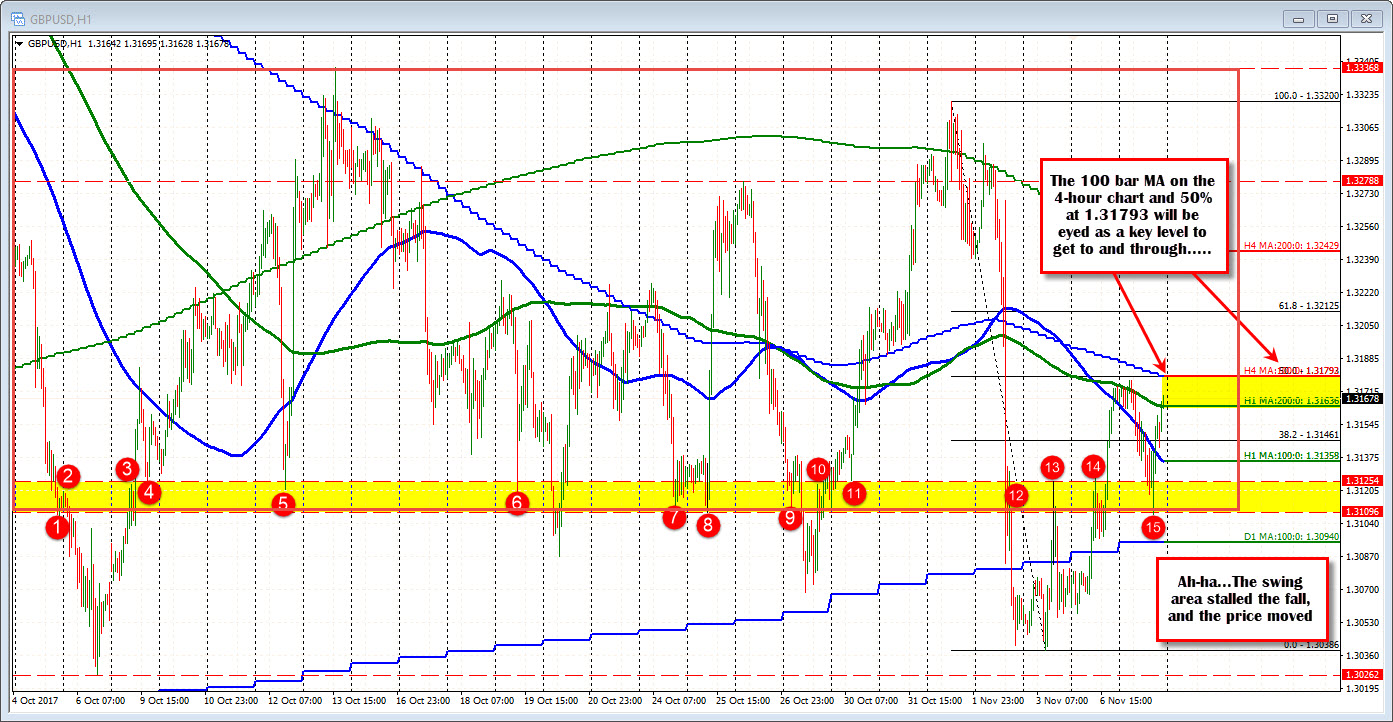
50% retracement and 100 bar moving average on 4- hour hour chart eyed
The GBPUSD has had an down and up day. The day started at the high. That high tested the 200 hour MA and the 50% of the move down from the October 31 high.

The move lower stalled in the NY session at the low of a swing level (see red numbered circles and yellow area) between 1.31096 and 1.31254. The pair was close to breaking below that area, but momentum stalled and the price started back higher.
The subsequent move back higher is returning the price back to the closing level from yesterday at 1.3167. The price is trading at 1.3169 currently.
Technically, the pair is back above the 100 hour MA at 1.3135, the 200 hour MA at 1.31636. The last MA of the cluster is the 100 bar MA on the 4-hour chart. This MA comes in at 1.31793. It is also at the same level of the 50% retracement of the move down from the October 31 high.
So the day started testing the 200 hour MA and the 50% retracement. We are ending the trading day near the 100 bar MA on the 4-hour chart and the same 50% retracement level.
In the new day that 1.31793 will be the barometer for bullish above and bearish below. A break above starts targeting the 61.8% at 1.32125 and then the 200 bar MA on the 4-hour at 1.32429. Stay below and it may be back down to the 1.31096-25 area for yet another test. Key level for trading bias in the new day.
The GBPUSD still struggles with finding a trending directional bias, but technical level (floor area and moving averages/retracements) are helping to define low risk trading opportunities.