Trend line on the daily cuts across at 0.8773 area
The EURGBP is moving higher and in the process got close to a topside trend target on the daily chart. That trend line cuts across at 0.8773. The high reached 0.8767 today.
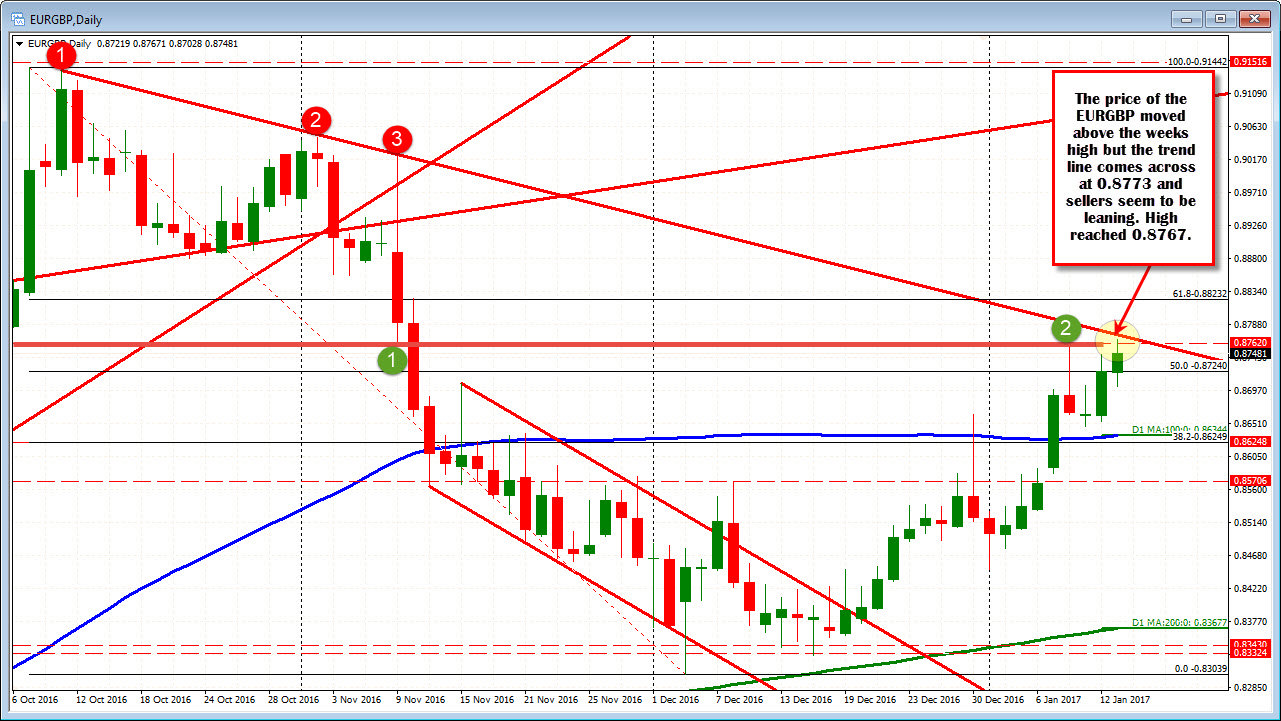
That trend line connects highs from October and November. Weakness in December kept the pair well away, but the rally from the mid December low, has the price back above the 50% at 0.8742 (a risk level for buyers/bulls now). The price did move above the week's high level from Tuesday at 0.8762, but the topside trend line resistance is proving to be too much on the first look and we have wandered back lower (and back below the old week's high price).
Is the rally over? Well could be, but there is more work to do. We do know that the sellers leaned. When the price breaks to new couple month highs and quickly stalls just before a trend line, that is traders leaning against likely stops on a break above the trend line. So risk was defined and limited and sellers took advantage.
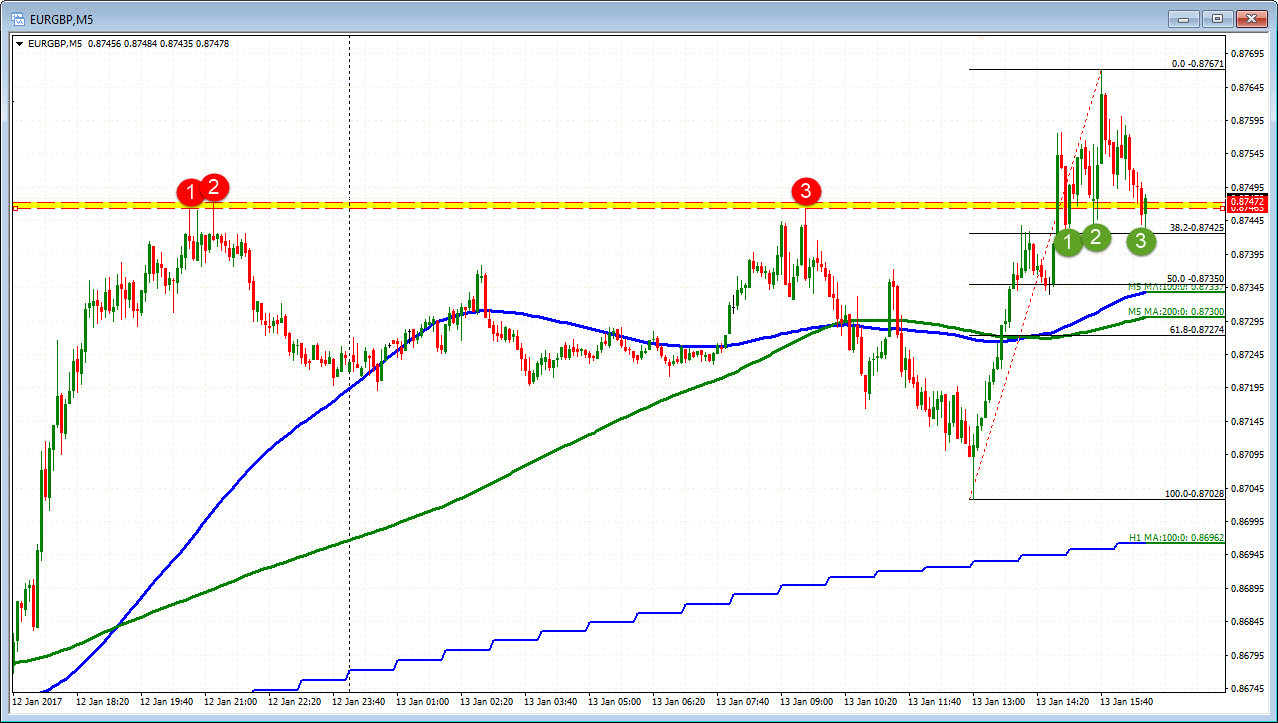
Drilling to the 5 minute chart, the price decline has come down to test the 38.2% at 0.8742 and the prior swing highs at 0.8746-47 area (see red and green circle area). There are three lows around that area on the intraday chart.
If we are to declare tha a peak may be in place against the topside trend line, a move - and staying below area - will give shorts more confidence (and may attract more selling). There are more hurdles/targets to get to and through (like the 100 and 200 bar MA in the same chart - blue and green lines), but it is a step in that direction.
So the buyers and sellers are using technical levels above and below to stake a claim. Sellers from above against the key trend line are doing ok, but there is more work to be done at the first key support area if the momentum is to continue.