

High finding resistance at the 0.7700 area
The AUDUSD surged higher in trading today on the back of much better trade data.
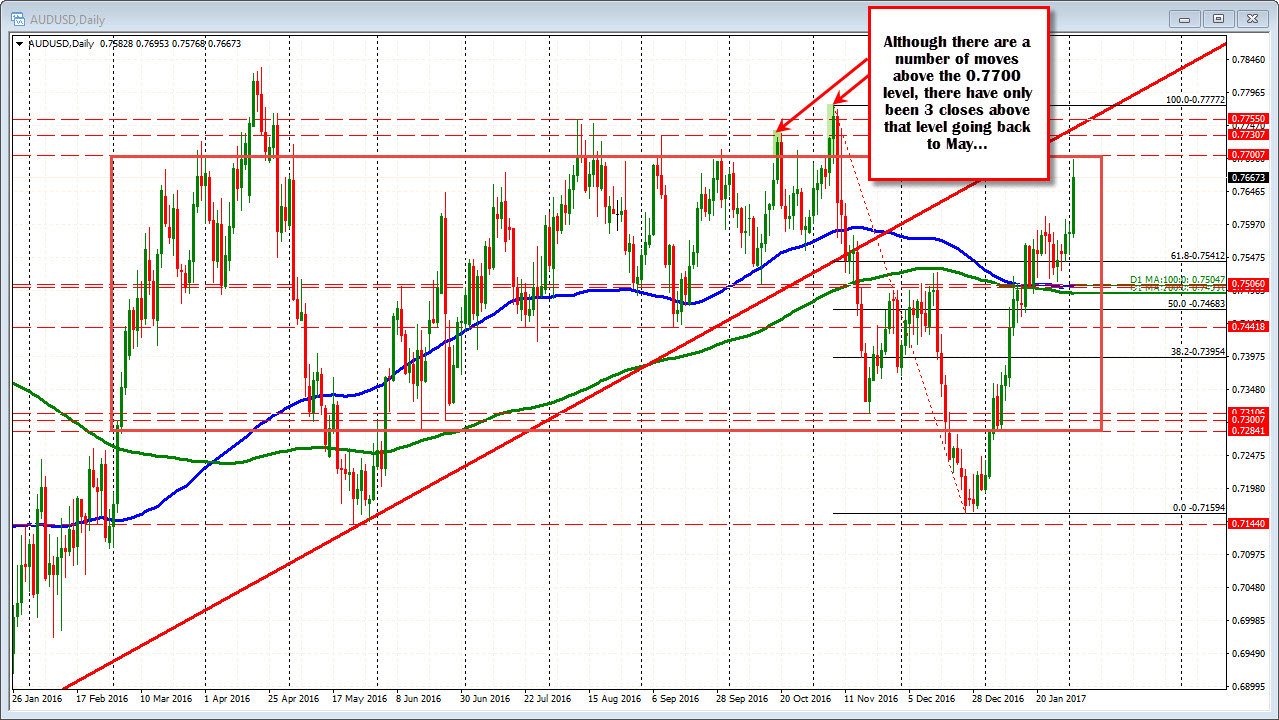
The move higher took the pair up toward the 0.7700 level. Since May there have been 3 days where the price closed above that level. The last time in November. The high today reached 0.76953. Keep that 0.7700 level in mind. A move above would be more bullish for the pair.

Looking at the 5-minute chart, the price is showing some corrective pressure.
- The price has two separate highs at 0.7695
- The price has moved below the 100 bar MA
- The price has moved below trend line support
What it needs to do now for further corrective potential is:
- Get below the recent lows at 0.76616 and
- Get below - and stay below - the rising 200 bar MA at 0.7659
Note that those are just the minimum for potential reversal.
What ruins the correction idea?
A move back above the broken 100 bar MA at 0.7676 and the broken trend line.
---------------------------------------------------------
PS. For more talk about the AUDUSD from a technical perspective take a look at the video I did a few weeks ago on the pair. I speak about the 0.7700 level specifically and also the 100 and 200 day MA which held support before the most recent surge higher. You can skip the talk about the CPI data at the beginning.
The bullish move has seen the horse leave the barn already (based against the daily MA), but it might help some traders understand the importance of having a plan of key levels as you prepare your next trade - including the sellers against the 0.7700 level today and the buyers down at the 100 and 200 day MAs.
Watch the video with an eye on the current daily and hourly charts.
.