

Being up is important because 10 of 11 days have been down.
The GBPUSD has been down on 10 of the last 11 days. BUT the last two trading days were only down a few pips on each day. So you might conclude that the momentum was fading.
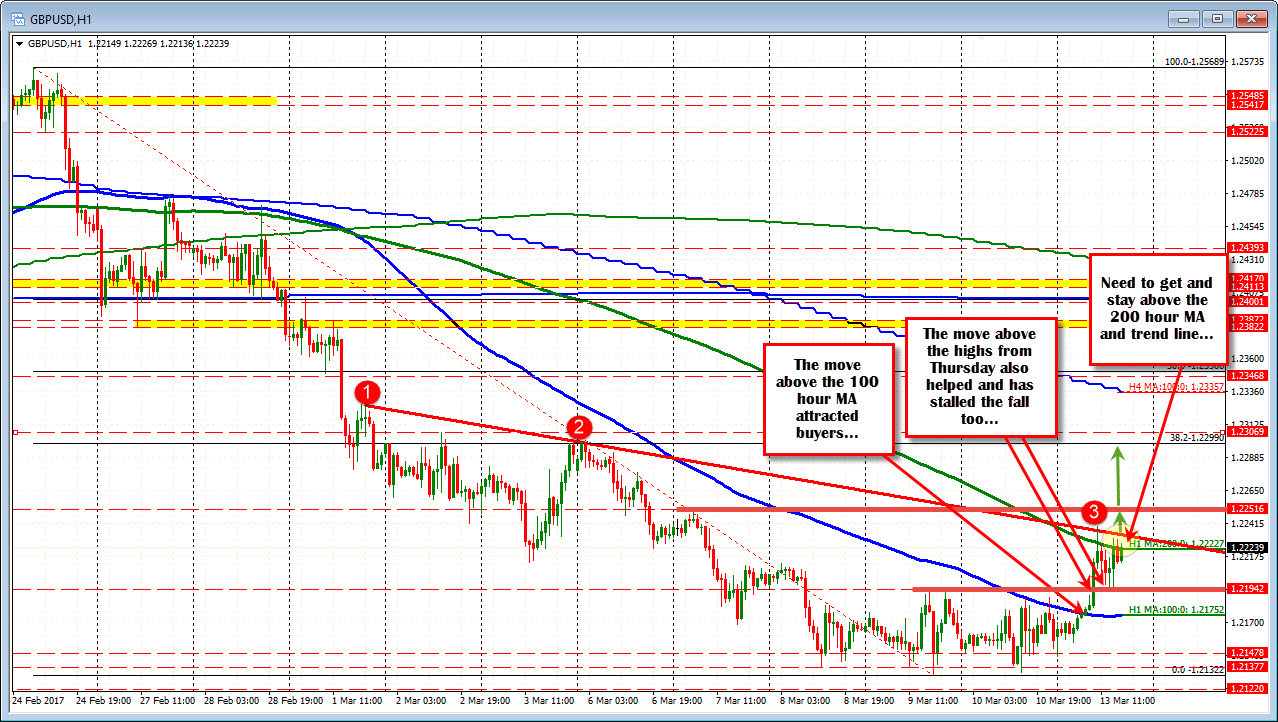
That consolidation did allow the 100 hour MA (blue line in the chart above) to catch up to the price. Today, the price moved above that MA level in the Asian session. Did it turn the bias around? It certainly helped. The price has not traded for long above the 100 hour MA since Feb 24th (on Friday is peaked above the line and failed).
Today's break sent the price up to the 200 hour MA and a topside trend line. The 200 hour MA has been broke, but the trend line has stalled the rally. The trend line comes in at 1.2235 currently. The corrective move lower (off the trend line) stalled at the Thursday double top. Buyers are trying to keep the price action moving higher, but we need to extend above those topside resistance levels. Get and stay above and the traders can start probing a bigger corrective move.
Upside targets?
- 1.2251 - high from last Tuesday
- 1.2299 - natural resistance at 1.2300. The 38.2% is of the move down from Feb 24th high. The level also corresponds with high from March 3 and March 6th. The 1.23069 is also in that area and should be a tough nut to crack when tested the first time.
Risk for longs? 1.2194. We have been down 10 of 11 days. If we are gong higher, it is not good to take steps backwards. A move below that level is a step backwards.