Dollar index climbs above the 200-day moving average for the first time since May last year in yesterday's trading

The break came during European trading, and the dollar didn't look back from there as US traders pushed the greenback higher on the day.
The highs yesterday tested the 92.50 levels - which was pointed out here - before tailing off a little but the "damage" was already done. The break of the 200-day MA (blue line) is the most notable thing on the charts as the dollar index trades above both the 100-day (red line) and 200-day MA for the first time since March last year.
In doing so, momentum and bias has switched to bullish. Never thought you'd actually say that about the dollar after the fall since December, eh?
The issue of the twin deficits is being put in the back pocket for now, and it'd be wise not to fight it. The old market adage is "never catch a falling knife" and it applies here too - in the opposite manner that is.

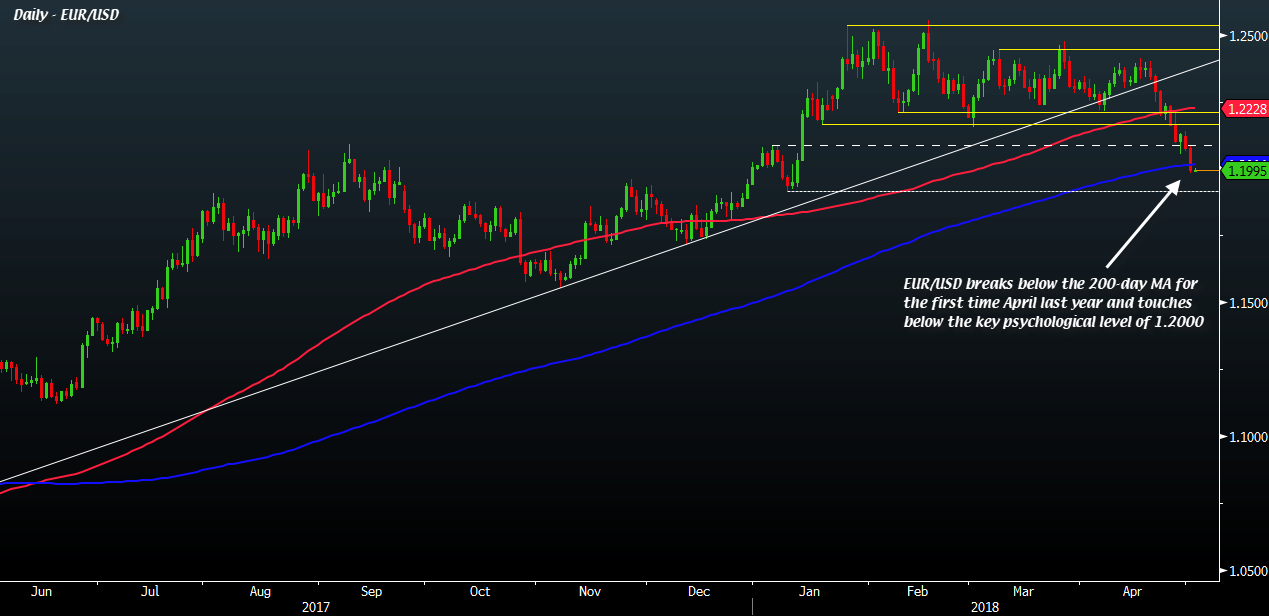
But the break of the dollar index's 200-day MA isn't the only one yesterday. EUR/USD also broke below the 200-day MA @ 1.2016 and even landed a daily close below 1.2000. That is massive from both a technical and psychological perspective.
Now, European traders will be back from a break yesterday so we'll have to see what their say is on the matter. But after taking out barrier options at 1.2000 as well, the figure level has lost some of its allure in keeping the pair afloat it would seem.
The next key support level to the downside is the 9 January low @ 1.1916 (dotted line).


