
CME equities options data shows investors are still hedging, even as Nasdaq risk looks more balanced
Key takeaways
CME equities data around 28 April 2026 shows a market that is active, liquid, and still heavily hedged.
S&P 500 options remain strongly put-heavy, suggesting institutions are still carrying downside protection.
Nasdaq options are also hedged, but much less defensively positioned than S&P 500 options.
Russell 2000 options show continued caution toward small caps.
For beginners, the main lesson is simple: a rising market can still be heavily hedged underneath.
What the latest CME equities data tells us
The latest CME Equities Market Overview shows a market that is not panicking, but is clearly not relaxed either.
Futures trading volume rebounded sharply on 28 April, rising to 5.92 million contracts, compared with 4.72 million the prior day. However, futures open interest stayed relatively stable near 5.27 million to 5.31 million over the last several sessions.
For beginners, this matters because volume and open interest tell different stories.
Volume shows how much trading happened. Open interest shows how many contracts remain open after the trading session. When volume jumps but open interest does not expand dramatically, it often points to active repositioning, hedging, rolling, or short-term trading rather than a major new directional bet.
In plain English: traders were busy, but the market did not show a clear sign that everyone was suddenly making a fresh bullish or bearish commitment.
The global markets are currently caught in a high-stakes waiting game, driven largely by the persistent stalemate between the U.S. and Iran. This geopolitical tension has pushed oil back into triple-digit territory, creating a massive supply shock that is paralyzing central banks. While the Federal Reserve is expected to hold rates steady today, I found it interesting that the focus has shifted entirely to Jerome Powell’s final press conference. With inflation expectations jumping—most notably in the Eurozone, where sentiment has hit its lowest point since 2020—Powell faces the difficult task of maintaining neutrality to give his successor enough room to navigate an increasingly hawkish landscape.
The strain of this "higher-for-longer" reality is becoming visible across all asset classes, from the Indian Rupee’s slide toward record lows to Gold’s recent technical breakdown. Even the tech sector is showing signs of nerves; despite a flurry of earnings from the "Magnificent Seven," U.S. futures remain muted as investors weigh resilient labor data against rising energy costs. I noticed that while Bitcoin continues to flirt with $80,000, the immediate structure looks fragile, much like the USD/CAD which is pulling back into a major trendline ahead of today's critical policy decisions.
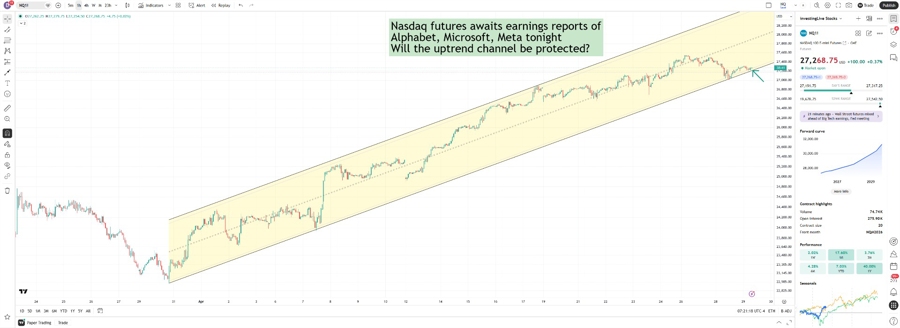
Those that have got to know some of my analyses, my toolkit is comprehensive but I really like those simple charts as part of the orientation, even if I look at it to watch for 'fakies' or traps and regardless of if I deep dive into tick, orderflow data analysis, volume profile or indicators. Above, the Nasdaq 100 futures (NQ1!) 1-hour chart illustrates a well-defined ascending channel that has governed price action for the past month. As of late April, the index is trading near the 27,268 level, resting precariously on the lower boundary of this technical corridor. This specific zone has historically acted as a springboard for buyers, maintaining the broader bullish structure that has delivered a 40% gain over the last year.
The current consolidation at this support line highlights a critical juncture for the index. With heavyweights Alphabet, Microsoft, and Meta set to report earnings tonight, the market is essentially holding its breath. If the results are strong enough to protect this uptrend channel, it could validate the current support and trigger a push toward the upper resistance levels near 28,000. Conversely, a failure to hold this line would mark a significant technical breakdown, potentially shifting the near-term bias from bullish to defensive.
Everyone is waiting for 3 mega potential catalysts for the next move: Alphabet, Microsoft, Meta al reporting earnings tonight
S&P 500 options remain heavily defensive
The biggest message in the report comes from the options market.
On 28 April, S&P 500 options volume was heavily skewed toward puts:
| S&P 500 options | Calls | Puts | Put share |
|---|---|---|---|
| Volume | 367,798 | 590,715 | 61.63% |
| Open interest | 1,453,664 | 4,437,625 | 75.33% |
A put option is often used as downside protection. Investors may buy puts to hedge a portfolio, or they may use put spreads to define bearish exposure.
The most important number here is not just daily volume. It is the 75.33% put share in open interest. That means a large portion of existing S&P 500 options positioning is still tied to downside protection.
This does not automatically mean the market must fall. But it does tell us that many institutional players are still protecting against downside risk.
Defensive does not always mean bearish
This is where many newer traders get confused.
A put-heavy market can mean investors are nervous. But it can also mean the market is already well protected. If bad news does not arrive, or if earnings come in better than feared, some of that protection can be reduced. That process can sometimes support rallies.
So the correct beginner takeaway is not:
“The market is full of puts, so stocks must go down.”
A better takeaway is:
“The market is heavily hedged, so traders should expect two-sided risk. Downside fear is real, but if price holds firm, hedging unwind and short-covering can also support upside.”
E-mini S&P 500 options show protection beyond the very short term
The E-mini S&P 500 options data is also heavily put-weighted across different expiry windows.
| Expiry bucket | Put share of volume | Put share of open interest |
|---|---|---|
| 0-5 days | 63.77% | 75.29% |
| 6-28 days | 73.21% | 76.52% |
| 29-96 days | 68.96% | 79.72% |
| 97+ days | 68.27% | 64.05% |
This is important because it shows the hedging is not only in very short-term options.
The 29-96 day bucket had almost 80% put open interest, which suggests some investors are protecting against more than just one trading day or one earnings headline. They may be hedging broader macro risk, policy uncertainty, valuation risk, or a potential market pullback over the next several months.
Nasdaq options look less defensive than S&P 500 options
One of the more interesting parts of the CME report is the difference between S&P 500 and Nasdaq positioning.
E-mini Nasdaq-100 options are still put-heavy, but the skew is much less extreme.
| Expiry bucket | Put share of volume | Put share of open interest |
|---|---|---|
| 0-5 days | 53.16% | 55.93% |
| 6-28 days | 55.75% | 58.11% |
| 29-96 days | 40.55% | 56.11% |
| 97+ days | 48.35% | 54.03% |
For beginners, this is a key point.
The broad market may be heavily hedged, but technology and growth exposure do not look as defensively positioned as the S&P 500. That may suggest investors are still willing to own mega-cap tech risk, while using broader index hedges to protect against macro downside.
This is especially relevant during mega-cap earnings season, when names like Alphabet, Microsoft, Amazon, Meta, Apple, and Nvidia can drive index direction.
Small caps remain under pressure from defensive positioning
Russell 2000 options also show a defensive tone.
| Expiry bucket | Put share of volume | Put share of open interest |
|---|---|---|
| 0-5 days | 67.06% | 65.68% |
| 6-28 days | 71.86% | 74.57% |
| 29-96 days | 81.13% | 70.09% |
| 97+ days | 53.81% | 62.64% |
The Russell 2000 tracks smaller-cap companies, which are often more sensitive to economic growth, financing conditions, and domestic demand.
Heavy put positioning here suggests investors remain cautious on small caps. In simple terms, the market may prefer large, profitable mega-cap companies over smaller cyclical stocks that are more vulnerable if growth slows.
Short-term options dominate trading
Another major theme is the dominance of short-dated options.
For E-mini S&P 500 options, the 0-5 day expiry bucket had 3.63 million contracts in volume, far above the other expiry groups.
| Expiry bucket | Total volume |
|---|---|
| 0-5 days | 3.63M |
| 6-28 days | 1.29M |
| 29-96 days | 549K |
| 97+ days | 152K |
This shows how focused the market is on near-term risk.
Short-dated options can make markets more reactive. Around earnings, inflation data, Federal Reserve updates, and geopolitical headlines, traders often use these short-term contracts to quickly hedge or speculate.
For beginners, the practical lesson is that intraday and multi-day moves can become sharper when short-dated options activity is elevated. Price may move quickly toward important option strike areas, then reverse just as quickly if positioning changes.
Key S&P 500 strike areas to watch
The CME report also shows notable options activity around several strike zones, including approximately:
5,850
7,090 to 7,165
7,240
7,465
8,550
The 5,850 area stands out visually as a major concentration.
These strike zones can sometimes act as magnets, resistance areas, support areas, or volatility zones, depending on whether the positioning is mostly calls, puts, spreads, or hedges.
Beginners should not treat these levels as guaranteed turning points. Instead, they should treat them as areas where market behavior may become more sensitive.
What this means for traders and investors
The latest CME equities overview leans defensive, but not panic-bearish.
The market is still heavily hedged, especially through S&P 500 and Russell 2000 options. However, Nasdaq options are more balanced, which may suggest investors are still willing to hold technology risk while protecting against broader market weakness.
That creates a mixed but useful message:
Broad-market hedging remains heavy.
Small-cap caution remains visible.
Mega-cap tech may still be relatively better supported.
Short-term options activity can amplify fast price moves.
Put-heavy positioning can create both downside risk and upside squeeze potential.
The beginner lesson
Options positioning is not a crystal ball. It does not tell us exactly where the market will go next.
But it does help us understand the market’s emotional and institutional backdrop.
Right now, the message is that investors are not blindly bullish. They are active, tactical, and still carrying protection. At the same time, the less defensive Nasdaq positioning suggests the market has not fully abandoned risk appetite, especially in mega-cap technology.
For traders, this means scenario planning matters.
If the S&P 500 weakens and key levels break, heavy put positioning may reflect real downside concern. But if earnings hold up and price refuses to fall, the same put-heavy positioning could help fuel a relief rally as hedges are reduced.
In short: this is a market that remains cautious underneath the surface, even if the headline index action looks calm.


