FUNDAMENTAL OVERVIEW
The Nasdaq sold off yesterday after early reports suggested the third round of US–Iran talks had broken down, with Iran reportedly rejecting US demands. Later in the day, however, new headlines indicated that the discussions had actually made significant progress and that another round was scheduled for next week. This kind of back-and-forth on the macro and geopolitical front is keeping most markets rangebound.
Right now, the main risks for the Nasdaq are a potential US–Iran military escalation and a hawkish repricing of Fed interest rate expectations.
On the rates side, the market is still pricing in about 57 bps of easing by year-end. This outlook could be at risk of a hawkish repricing on further improvement in the US labour market data. In fact, Fed Governor Waller said that he would consider holding rates steady if we see another strong NFP report like January’s. That makes next Friday’s data especially important as solid numbers could weigh on equities in the short term as traders dial back expectations for rate cuts.
The bigger risk, though, is geopolitical. If a military conflict between the US and Iran were to break out, oil prices would likely surge. That would represent a negative shock to the global economy and raise stagflation concerns. The initial market reaction would almost certainly be a sharp move toward risk aversion, with equities selling off hard as growth expectations deteriorate.
To sum up, there are lots of downside risks at the moment with little reasons for a rally into new all-time highs. The macro backdrop remains broadly supportive, with easing inflation and a resilient labour market, but that picture could shift quickly. Traders will need to stay nimble.
NASDAQ TECHNICAL ANALYSIS – DAILY TIMEFRAME
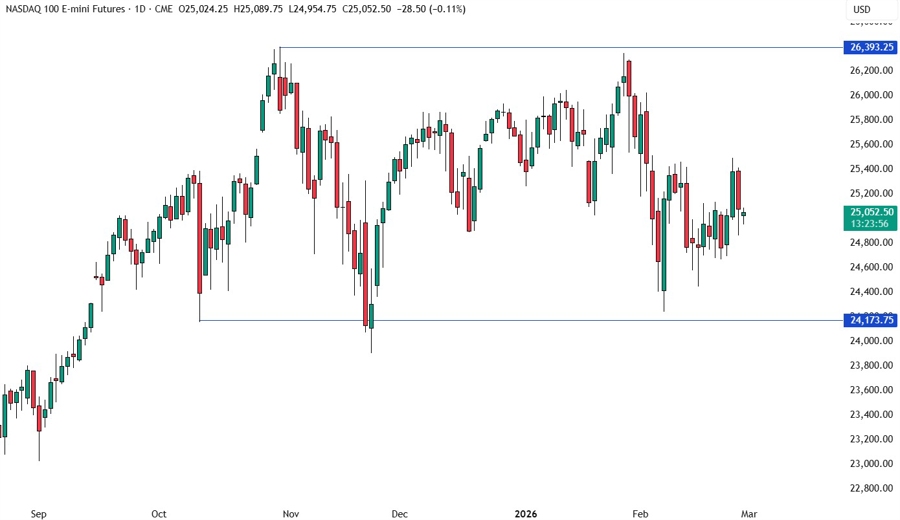
On the daily chart, we can see the Nasdaq has been trading in a wide range since October of last year. Such long consolidations generally lead to big trending moves once the price breaks out. Until then, the market participants will continue to play the range.
NASDAQ TECHNICAL ANALYSIS – 4 HOUR TIMEFRAME
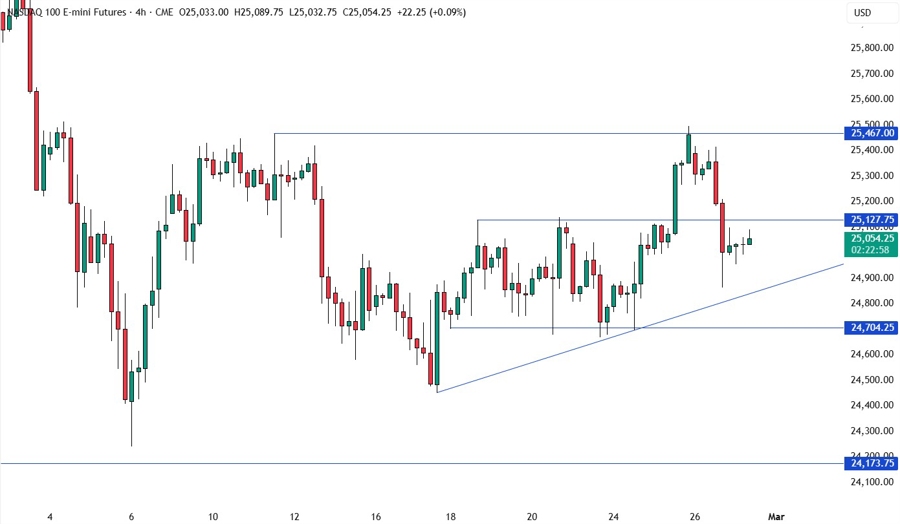
On the 4 hour chart, we got a breakout of the 24,700-25,127 range on Wednesday, but all the gains were eventually pared back yesterday on the US-Iran tensions. We now have an upward trendline defining the bullish structure on this timeframe. The buyers will likely lean on the trendline with a defined risk below the 24,700 support to keep pushing into new highs, while the sellers will look for a break below the trendline and the support to increase the bearish bets into the 24,200 level next.
NASDAQ TECHNICAL ANALYSIS – 1 HOUR TIMEFRAME
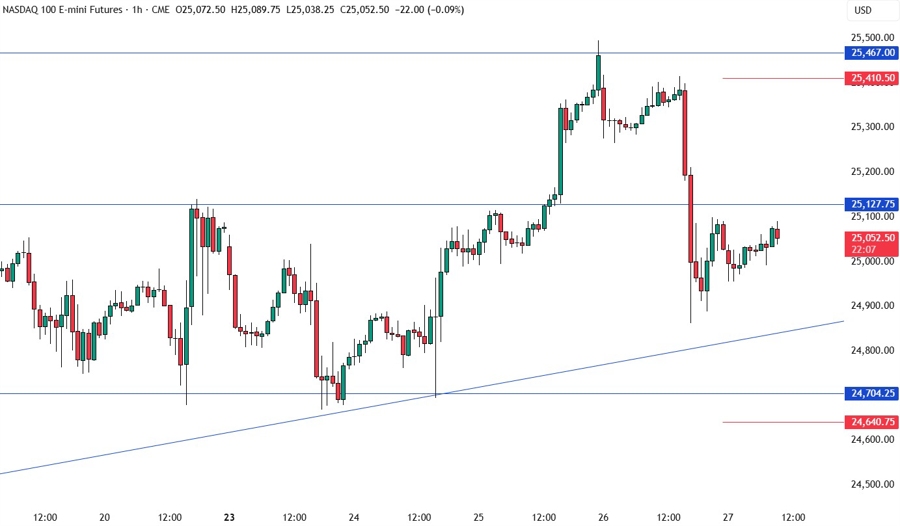
On the 1 hour chart, there’s not much we can add here as the buyers will have a better risk to reward setup around the trendline and the 24,700 support, but another break above the 25,127 could see the buyers piling in for a move back into the 25,500 level. The sellers, on the other hand, will likely step in around the 25,127 level with a defined risk above it to position for a break below the trendline. The red lines define the average daily range for today.
UPCOMING CATALYSTS
Today we conclude the week with the US PPI report but continue to watch out for US-Iran headlines.
