
KEY POINTS:
- UK data supports more rate cuts
- The BoE cut the Bank Rate to 3.75% as expected
- BoE Governor Bailey sounded more upbeat on disinflation with scope for more easing
- FTSE 100 gained on expectations of more policy easing, better growth
FUNDAMENTAL OVERVIEW
The BoE cut the Bank Rate to 3.75% as expected yesterday and sounded more upbeat on disinflation. This keeps the room for more easing intact, supporting the stock market into new highs.
The risk sentiment was also supported by a soft US CPI report. The hawkish risks are now behind us and the next key risk events will be in January, starting with the US NFP on January 9.
FTSE 100 TECHNICAL ANALYSIS - DAILY TIMEFRAME
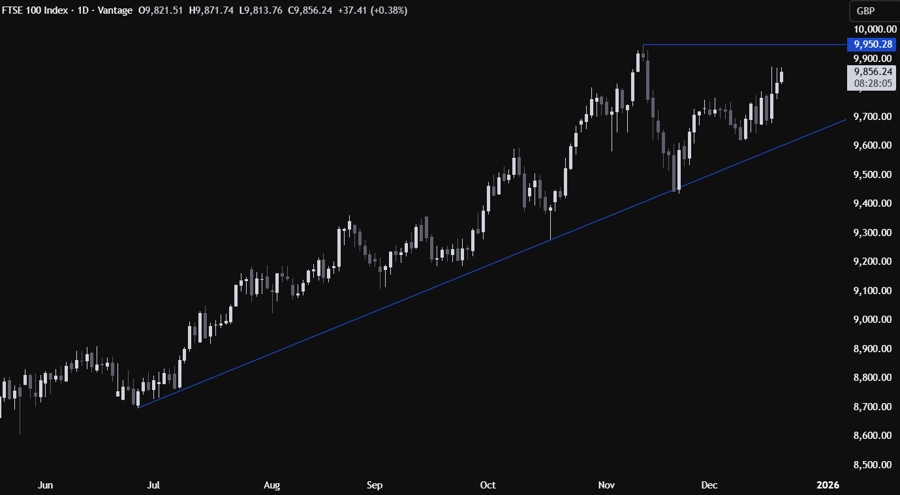
On the daily chart, we can see that FTSE 100 (CFD contract) bounced from a major trendline on November 21 when Fed’s Williams lift the global risk sentiment by endorsing a rate cut in December. We had some rangebound price action since the first week of December, but following the soft UK CPI, the market broke out to the upside. The natural target for the buyers should be of course a new all-time high. The sellers, on the other hand, will wait for the price to reach the all-time high to position for a drop back into the trendline.
FTSE 100 TECHNICAL ANALYSIS – 4 HOUR TIMEFRAME
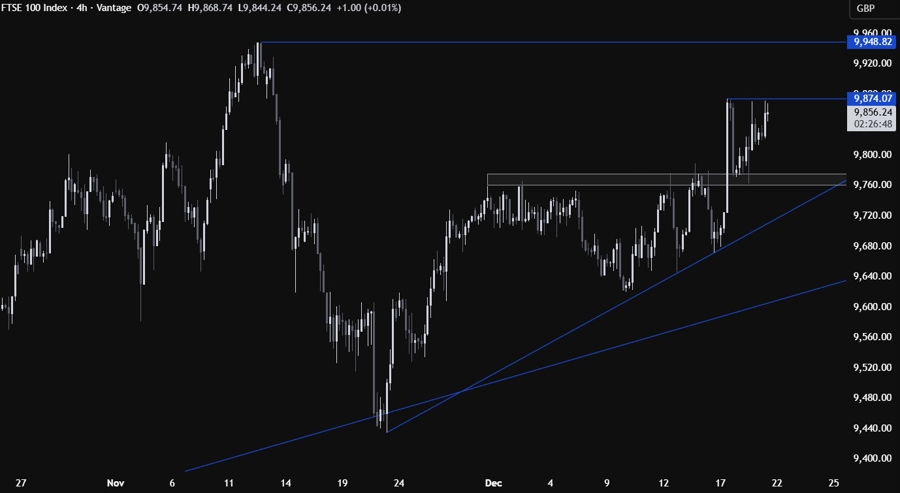
On the 4 hour chart, we can see that after the strong rally triggered by the soft UK CPI report, the market pulled back to retest the broken resistance-turned-support around the 9760 level. The buyers stepped in there with a defined risk below the support to position for a rally into a new all-time high.
The price is now testing the recent highs around the 9874 level. This is where we can expect the sellers to step in with a defined risk above the highs to position for a move back into the support. The buyers, on the other hand, will look for a break higher to increase the bullish bets into new all-time highs.
FTSE 100 TECHNICAL ANALYSIS – 1 HOUR TIMEFRAME
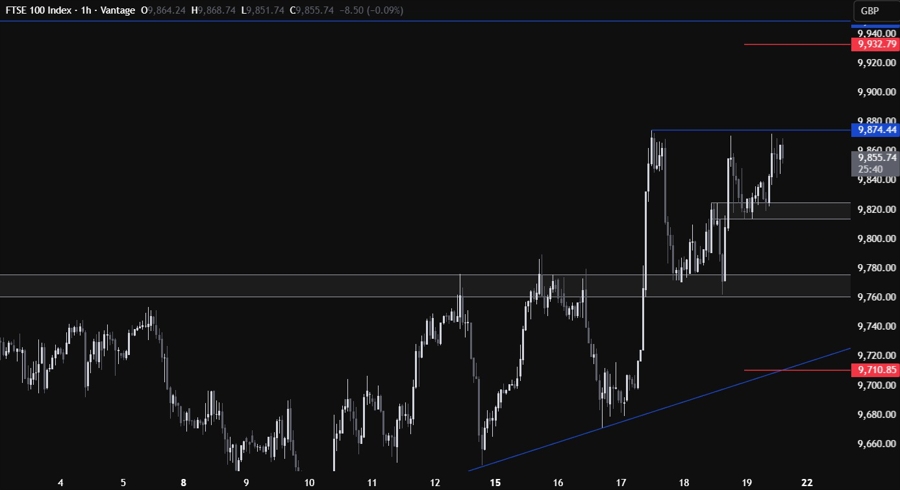
On the 1 hour chart, we can see that we have a minor support zone around the 9820 level. If we get a pullback into that level, we can expect the buyers to step in with a defined risk below the minor support to target a break above the 9874 level. The sellers, on the other hand, will look for a break lower to increase the bearish bets into the 9760 support next.
