
FUNDAMENTAL OVERVIEW
The S&P 500 has been surprisingly resilient this week even though the US-Iran war kept a lid on the market. The conflict entered its 7th day today and the risk of things deteriorating further and eventually dragging the stock market to new lows remains high.
In fact, the longer this war drags on, the worse the consequences will be for the global economy as growth expectations would turn negative and the Fed would not be able to act fast amid the inflationary pressures from higher energy prices. The bias for now remains neutral to bearish, so the bulls will need to wait for clear de-escalation before piling back in.
S&P 500 TECHNICAL ANALYSIS – DAILY TIMEFRAME
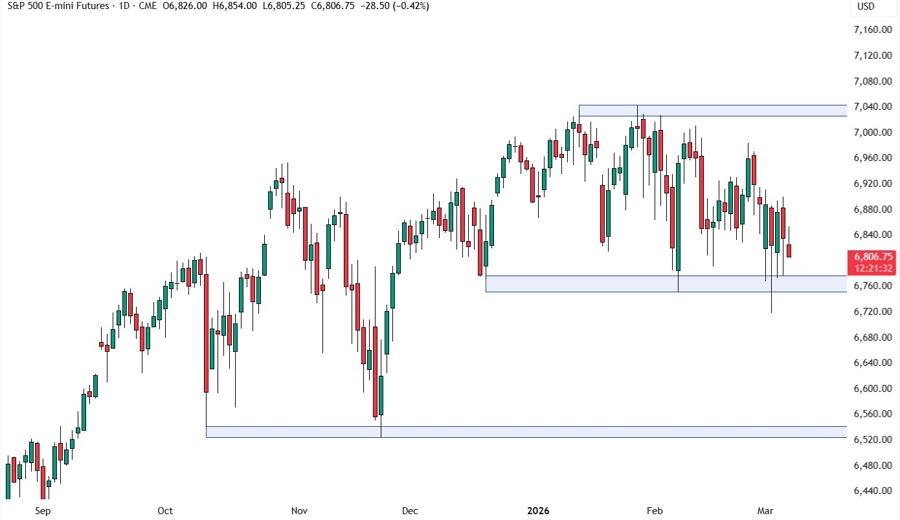
On the daily chart, we can see that the S&P 500 is trading around the lower bound of the 6,760-7,040 range as the US-Iran war has been weighing on the market. The buyers will likely continue to step in around the support with a defined risk below it to keep targeting the 7,040 resistance. The sellers, on the other hand, will look for a break lower to pile in for a drop into the 6,540 support next.
S&P 500 TECHNICAL ANALYSIS – 4 HOUR TIMEFRAME
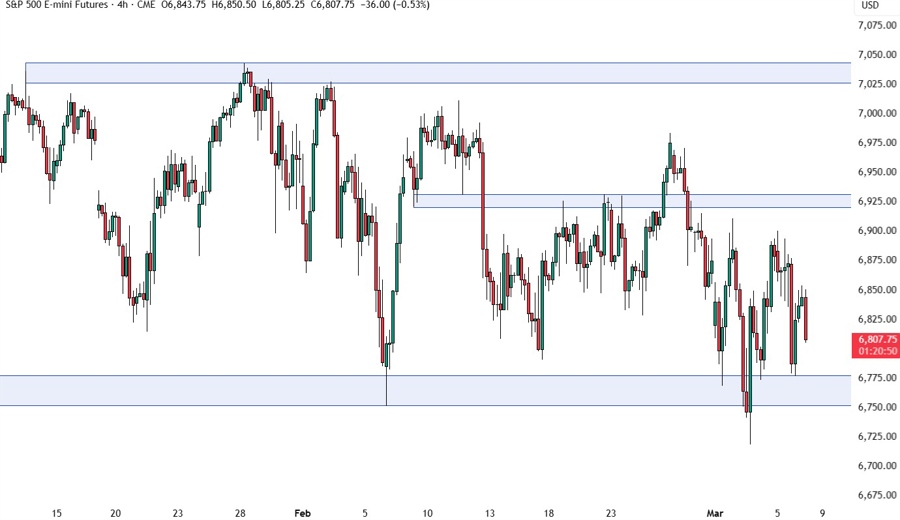
On the 4 hour chart, there’s not much we can add here as the price action has been rangebound amid the US-Iran war. The buyers will continue to step in around the support, while the sellers will look for a break to extend the drop into new lows.
S&P 500 TECHNICAL ANALYSIS – 1 HOUR TIMEFRAME
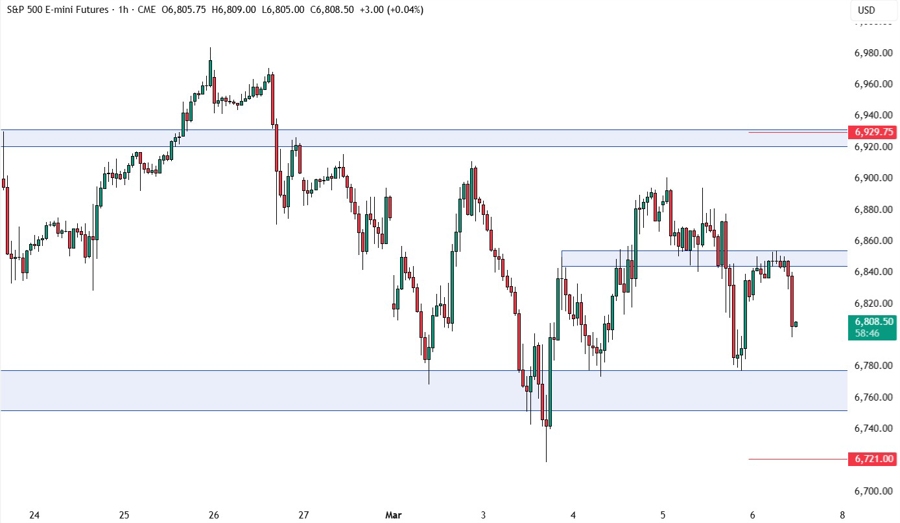
On the 1 hour chart, we have a minor resistance zone around the 6,850 level. If the price gets there, we can expect the sellers to step in with a defined risk above the resistance to position for a break below the major support around the 6,750 level. The buyers, on the other hand, will look for a break to pile in for a rally into the 6,920 resistance next. The red lines define the average daily range for today.
UPCOMING CATALYSTS
Today we conclude the week with the US NFP report but continue to keep an eye on the US-Iran war as that’s what the market is focused on right now.
