
Fundamental Overview
The S&P 500 rallied into a new al-time high yesterday following a weak US ADP report and a good ISM Manufacturing PMI release. The rally started soon after the ISM data and that might have been triggered by the higher employment index and lower inflation one. Kind of a goldilocks scenario.
The US government shutdown was ignored because it’s always short-lived and never a big deal. But the key part is the context because we have the Fed cutting interest rates. The first half of the year was all about Trump’s tariffs, but the second half is all about the Fed.
The focus should be on the labour market data because that’s what “forced” the Fed to start cutting rates and signal two more by the end of the year. If the labour market were to improve in the next months, the Fed would start turning more hawkish and might even hold off on the expected rate cuts. An October rate cut was never in jeopardy; it’s the December one that could be skipped but of course we will need strong labour market data. For now though, the Fed support is bullish for the stock market.
Problems arise when the economy gets too hot and that's when the Fed support wanes and the central bank starts to work against the market. And this is where we could get the pullbacks (and eventually even a crash).
Right now, the market is pricing 114 bps of easing by the end of 2026 compared to just 75 bps projected by the Fed. This means that the market is too optimistic. Therefore, a hawkish repricing in those expectations should in theory provide a pullback in all asset classes. So, if you are waiting for a pullback, then wait for US data. If we get strong US data, especially on the labour market side, then we could finally get a decent pullback.
In this environment, one can just buy or wait, but definitely not sell (unless one does it for a quick trade supported by a catalyst). Once the market pricing gets back in line with the Fed's projections, then the stock market should restart its rally.
In fact, as long as the Fed's reaction function remains dovish, the downside will remain limited. This "melt-up" phase will likely go on as long as the Fed remains more focused on the labour market. Once inflation starts to become a serious worry, that's when we will finally get a meaningful correction (or even a bear market if the Fed starts to hike rates). Until then, the pullbacks will just be dip-buying opportunities.
S&P 500 Technical Analysis – Daily Timeframe
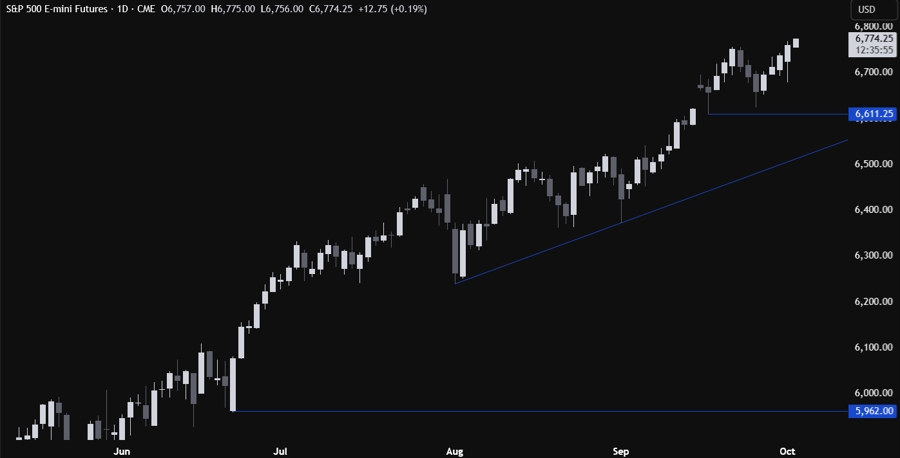
On the daily chart, we can see that the S&P 500 broke into a new all-time high yesterday. From a risk management perspective, the buyers will have a better risk to reward setup around the FOMC-low and the major trendline to position for new highs, while the sellers will look for downside breaks to target the 6,300 level. Such a big correction though looks unlikely unless we get a big growth scare or very strong US data that forces the Fed to adopt a more hawkish stance.
S&P 500 Technical Analysis – 4 hour Timeframe
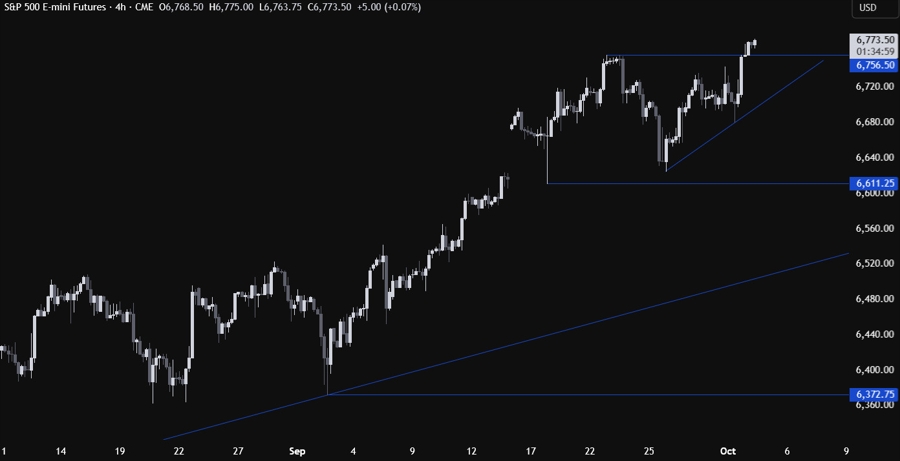
On the 4 hour chart, we can see that we have a minor upward trendline defining the bullish momentum on this timeframe. The old all-time high around the 6,756 level will now act as a minor support and the buyers will likely keep on piling in around these levels with a defined risk below the support. The sellers, on the other hand, will want to see the price falling back below the support to target a pullback into the minor upward trendline.
S&P 500 Technical Analysis – 1 hour Timeframe
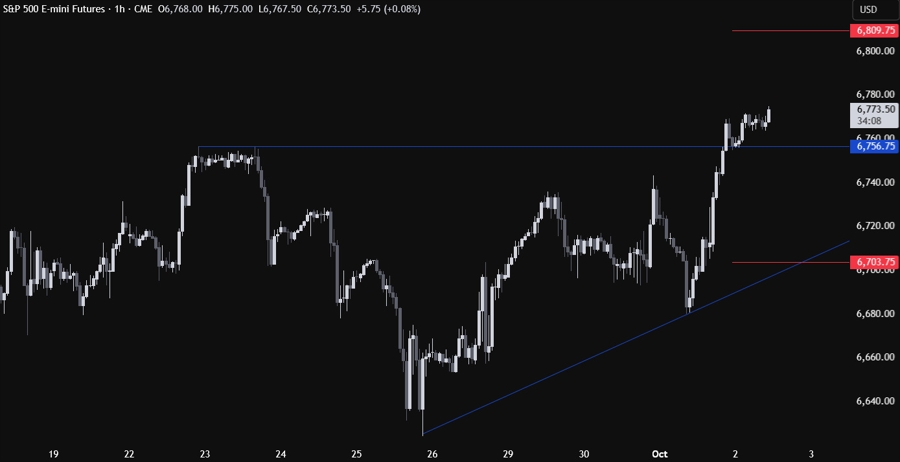
On the 1 hour chart, we can see more clearly the recent price action with the 6,756 level acting as minor support. There’s not much else we can add here as the buyers will continue to pile in with a defined risk below the support, while the sellers will wait for a drop back below that level to position for a pullback into the trendline. The red lines define the average daily range for today.
Upcoming Catalysts
Tomorrow we conclude the week with the US NFP report (in case government funding is restored) and the US ISM Services PMI.
