FUNDAMENTAL OVERVIEW
The S&P 500 went back into risk aversion in the final part of last week as prospects of a quick end to the war faded and oil prices resumed the upward trend towards triple digit levels.
The market continues to be driven solely by the US-Iran war and the disruption in the Strait of Hormuz. As of now, there’s no real solution in sight.
The longer this war drags on, the greater the negative impact will be on the economy and the stock market, especially given the Fed’s inability to cut rates without risking another inflationary wave.
The bulls should just wait for Trump to fold and end the hostilities as that will highly likely trigger a strong relief rally. Until then, the bearish bias will likely persist.
S&P 500 TECHNICAL ANALYSIS – DAILY TIMEFRAME
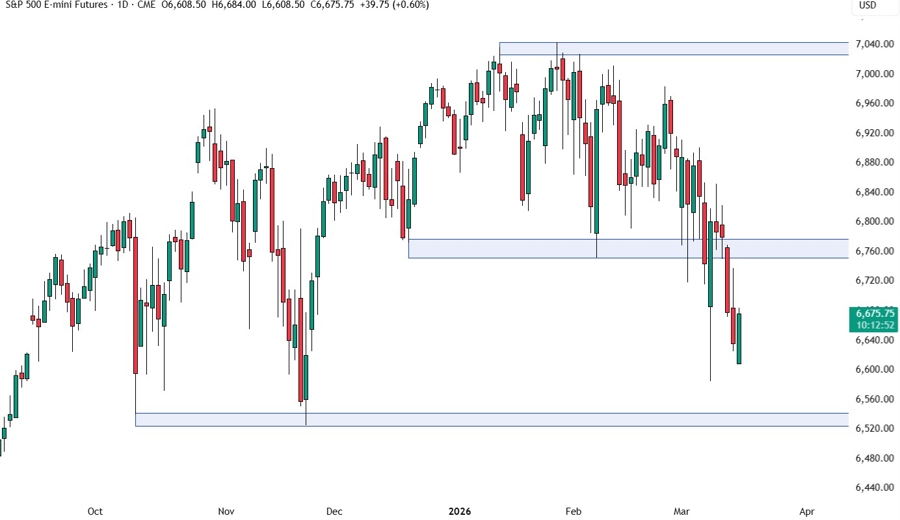
On the daily chart, we can see that the S&P 500 fell back below the 6,760 zone as risk aversion returned and eventually dropped close to monthly lows. The target for the sellers should be the November lows around the 6,540 level. If the price gets there, we can expect the buyers to step in with a defined risk below the support to position for a rally back into the 6,760 resistance.
S&P 500 TECHNICAL ANALYSIS – 4 HOUR TIMEFRAME
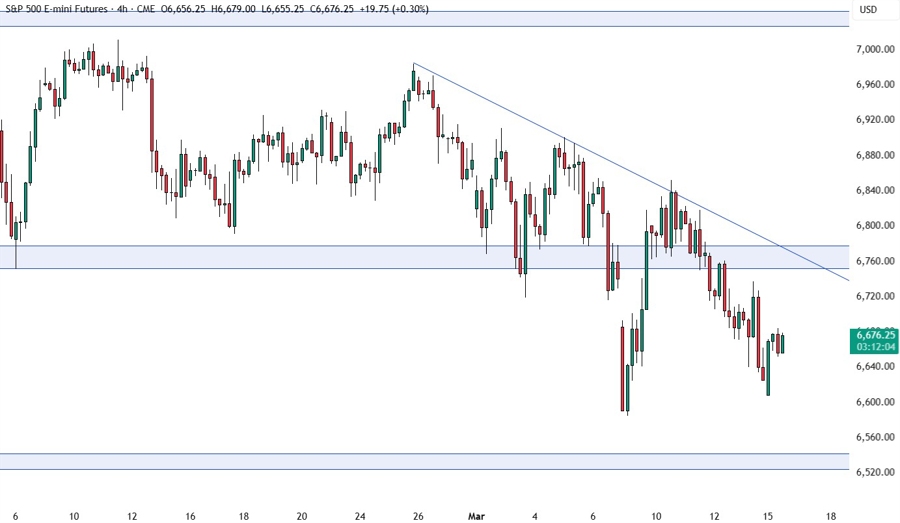
On the 4 hour chart, we have a downward trendline defining the bearish structure. If the price pulls back to the trendline, we can expect the sellers to lean on the trendline with a defined risk above it to keep pushing into new lows. The buyers, on the other hand, will look for a break higher to increase the bullish bets into new all-time highs.
S&P 500 TECHNICAL ANALYSIS – 1 HOUR TIMEFRAME
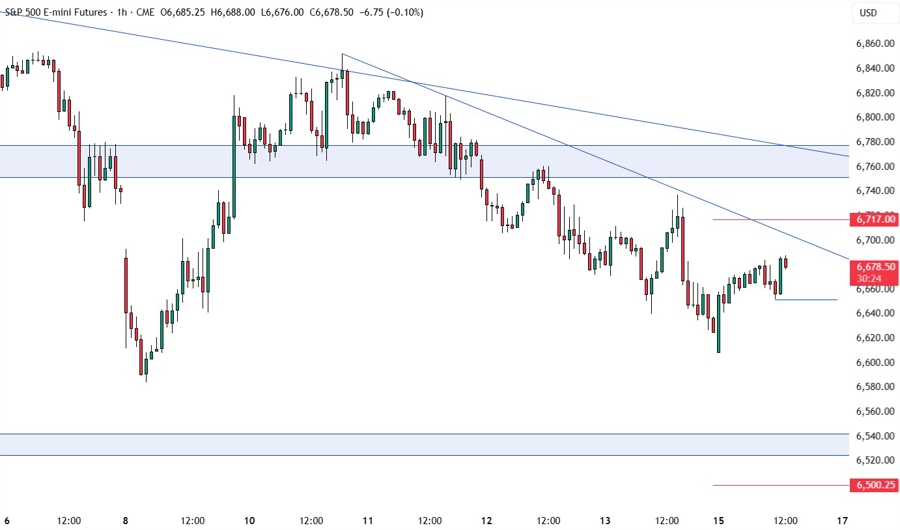
On the 1 hour chart, we have a minor downward trendline defining the bearish momentum on this timeframe. We can expect the sellers to lean on the trendline with a defined risk above it to keep pushing into new lows and increase the bearish bets on the break of the swing low around the 6,650 level. The buyers, on the other hand, will look for a breakout to pile in for a rally into the next major trendline. The red lines define the average daily range for today.
UPCOMING CATALYSTS
On Wednesday we have the US PPI report and the FOMC policy decision. On Thursday, we get the latest US Jobless Claims figures. The focus remains on the US-Iran war, so keep an eye on the headlines, especially those regarding the Strait of Hormuz.
