
FUNDAMENTAL OVERVIEW
The S&P 500 has been surging like crazy as traders kept on unwinding the bearish war-led bets amid US-Iran deal optimism. The US-Iran war has been pushing the market lower on negative growth expectations and as those expectations now get repriced on the positive side, the S&P 500 has lots of room to reach new record highs. The playbook is very similar to April 2025.
Looking ahead, everything now hinges on US-Iran talks expected to start tomorrow. Trump delivered some upbeat remarks tonight mentioning that we’re going to be watching an amazing two days ahead.
If negotiations were to break down again, we might see a short-term selloff, but as long as the ceasefire holds, the downside will likely remain limited. On the other hand, a peace deal might extend the rally into new record highs, although there’s also a good argument for an initial “sell the fact” type of reaction.
S&P 500 TECHNICAL ANALYSIS – DAILY TIMEFRAME
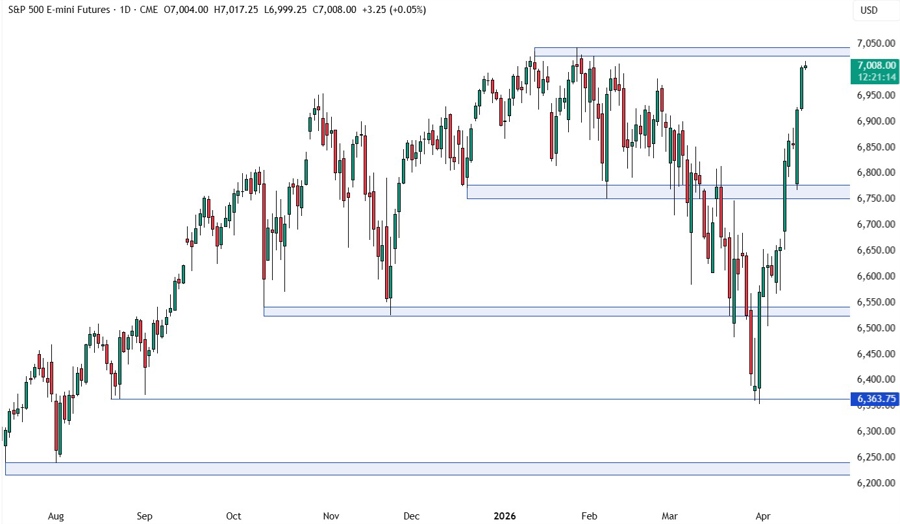
On the daily chart, we can see that the S&P 500 is now back near the all-time high. This is where we can expect the sellers to step in with a defined risk above the all-time high to position for a pullback into the 6,750 support. The buyers, on the other hand, will look for a break higher to increase the bullish bets into new record highs.
S&P 500 TECHNICAL ANALYSIS – 4 HOUR TIMEFRAME
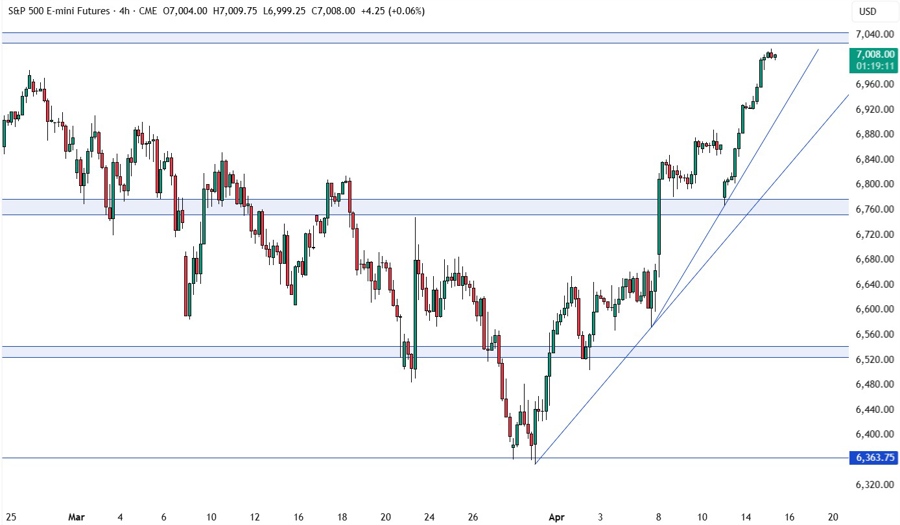
On the 4 hour chart, we have a couple of trendlines that could act as support. If we get a pullback, we can expect the dip-buyers to lean on the trendlines with a defined risk below them to keep pushing into new highs. The sellers, on the other hand, will look for a downside breaks to pile in for new lows.
S&P 500 TECHNICAL ANALYSIS – 1 HOUR TIMEFRAME
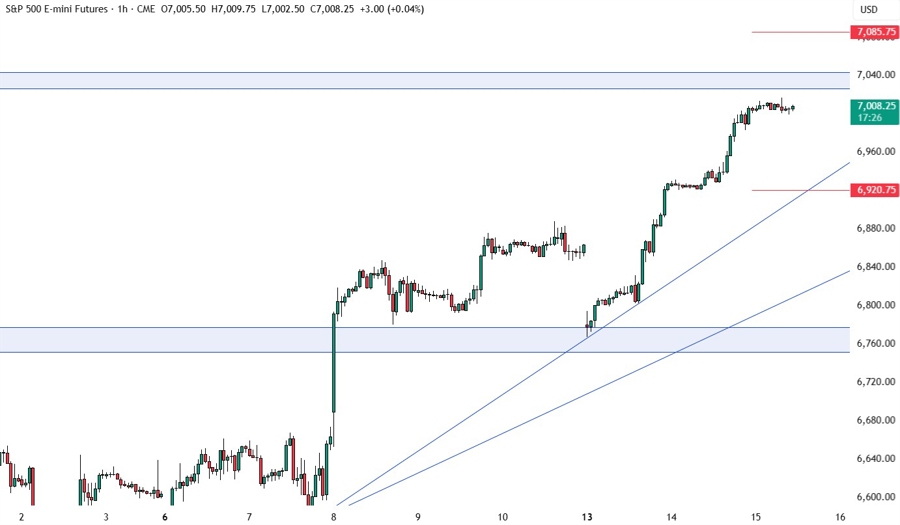
On the 1 hour chart, there’s not much we can add here as from a risk management perspective, the buyers will have a better risk to reward setup around the trendlines, while the sellers will need the price to break below them to open the door for new lows. The red lines define the average daily range for today.
UPCOMING CATALYSTS
Tomorrow we get the latest US Jobless Claims figures, but the focus remains on the second round of US-Iran negotiations expected in the next two days.


