FUNDAMENTAL OVERVIEW
The S&P 500 futures opened lower yesterday following Trump’s escalation over Greenland over the weekend. As a reminder, the US President threatened to impose 10% tariffs starting on February 1 on the UK, France, Germany and a few other European countries unless the U.S. is permitted to buy Greenland. The tariffs will rise to 25% from June 1 in case of no deal.
As we’ve seen last year, risk-off moves caused by Trump’s tariffs stemmed from growth worries. Growth expectations are the main driver of stock markets and when something leads to negative expectations, we generally get selling pressure until those expectations are corrected.
Everyone is now waiting for the famous TACO ("Trump Always Chickens Out") trade. The market's focus in now on this latest escalation, so monitoring the developments will be key and will offer trading opportunities. The risk sentiment will likely stay on the defensive until we get some clear de-escalation from Trump. If things escalate further, we should see more downside before Trump eventually folds.
Trump will deliver a speech tomorrow at the World Economic Forum in Davos. He already mentioned that he will talk about Greenland with other leaders, so we could get some new developments before the weekend.
Today we have also a potential US Supreme Court decision on Trump’s tariffs. If SCOTUS rules against tariffs, we could get a relief rally in the short-term, although Trump’s aides said that they have already a plan to impose tariffs with other means. If tariffs remain in place, then it shouldn’t change anything.
S&P 500 TECHNICAL ANALYSIS – DAILY TIMEFRAME
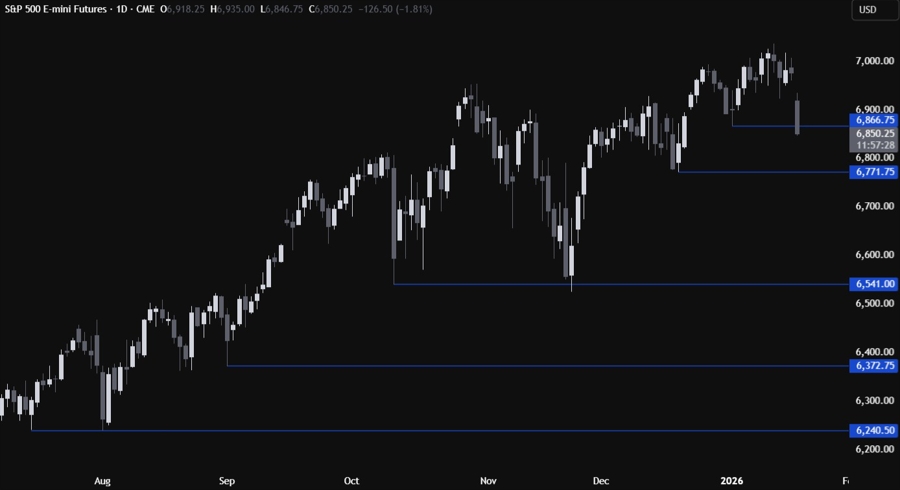
On the daily chart, we can see that the S&P 500 is breaking below the key swing level around 6,865. The sellers have likely piled in on the break to extend the selloff into the next major swing level at 6,770. The buyers will want to see the price rising back above the 6,865 level to start positioning for a rally into the weekend gap.
S&P 500 TECHNICAL ANALYSIS – 4 HOUR TIMEFRAME
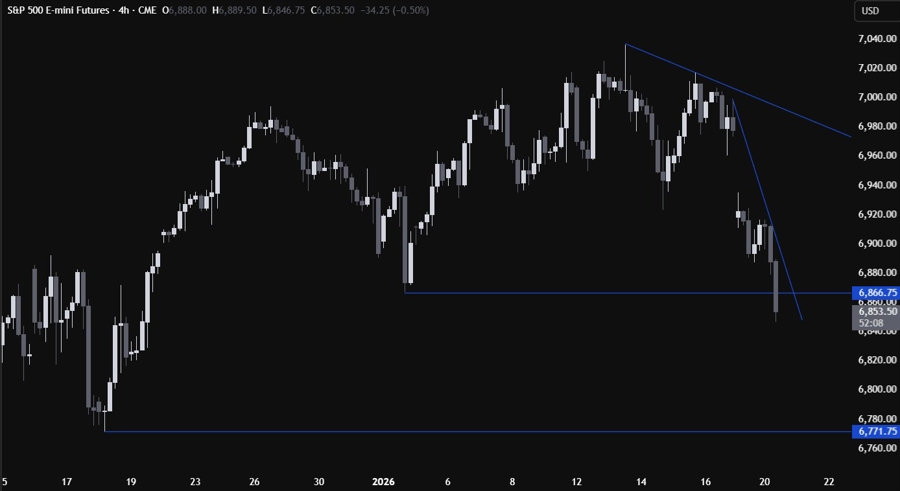
On the 4 hour chart, we can see that we have a downward trendline defining the bearish momentum. If we get a pullback, we can expect the sellers to lean on the trendline with a defined risk above it to keep pushing into new lows. The buyers, on the other hand, will look for a break higher to increase the bullish bets into new highs.
S&P 500 TECHNICAL ANALYSIS – 1 HOUR TIMEFRAME
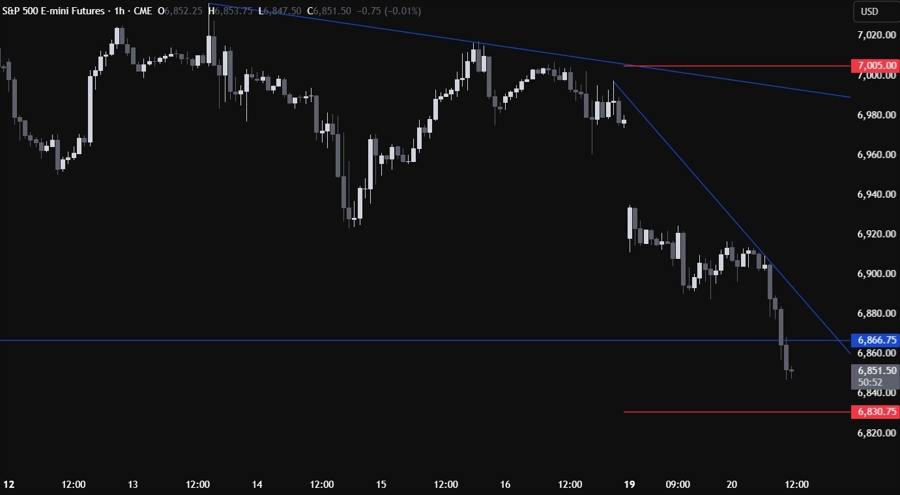
On the 1 hour chart, there’s not much we can add here as the sellers will look for shorts around the 6,885 level and the trendline, while the buyers will look for longs on the breakouts. The red lines define the average daily range for today.
UPCOMING CATALYSTS
Today we have the weekly US ADP jobs data and the potential US Supreme Court decision on Trump’s tariffs. Tomorrow, we have Trump’s speech at the World Economic Forum in Davos. On Thursday, we get the latest US Jobless Claims figures. On Friday, we have the US Flash PMIs. Watch out for headlines and Trump’s posts on Truth Social regarding Greenland as the market’s focus remains on this latest escalation.
