
FUNDAMENTAL OVERVIEW
The S&P 500 gave back most of the gains accumulated since Tuesday when Trump said that he would be open to end the war with Iran without the Strait of Hormuz opening condition. Later that day we also had the Iranian President saying that they were ready to end the war but wanted guarantees.
The catalyst for the selloff was Trump’s address to the nation where he was expected to give an “important” update on the US-Iran war. Unfortunately, Trump disappointed the market as he just repeated the same old stuff and kept his hawkish bias.
The market wrongly ignored yesterday’s news ahead of the speech. In fact, Trump posted this on Truth Social:
“Iran’s New Regime President, much less Radicalized and far more intelligent than his predecessors, has just asked the United States of America for a CEASEFIRE! We will consider when Hormuz Strait is open, free, and clear. Until then, we are blasting Iran into oblivion or, as they say, back to the Stone Ages!!! President DJT”
Trump self-imposed a 5-day ceasefire last week, then extended it by another 10 days (set to expire on April 6). At the same time, he made it clear that any ceasefire would depend on reopening the Strait, despite having downplayed that condition just a day earlier. He also ended his message with the usual threats.
Moreover, the White House indicated ahead of the speech that Trump would reiterate a 2–3 week timeline for ending the war. That stretches well beyond the current ceasefire window, leaving plenty of room for tensions to escalate again. This should keep the market under pressure (all else being equal).
S&P 500 TECHNICAL ANALYSIS – DAILY TIMEFRAME
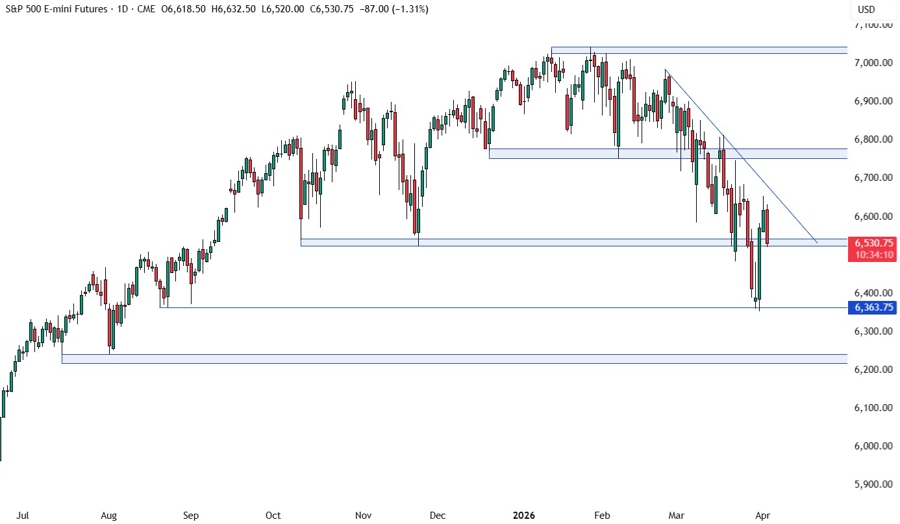
On the daily chart, we can see that the S&P 500 dropped back to the key 6,530 support zone. This is where we can expect the buyers to step in with a defined risk below the support to position for a rally into the trendline. The sellers, on the other hand, will look for a break to increase the bearish bets into the 6,363 level.
S&P 500 TECHNICAL ANALYSIS – 4 HOUR TIMEFRAME
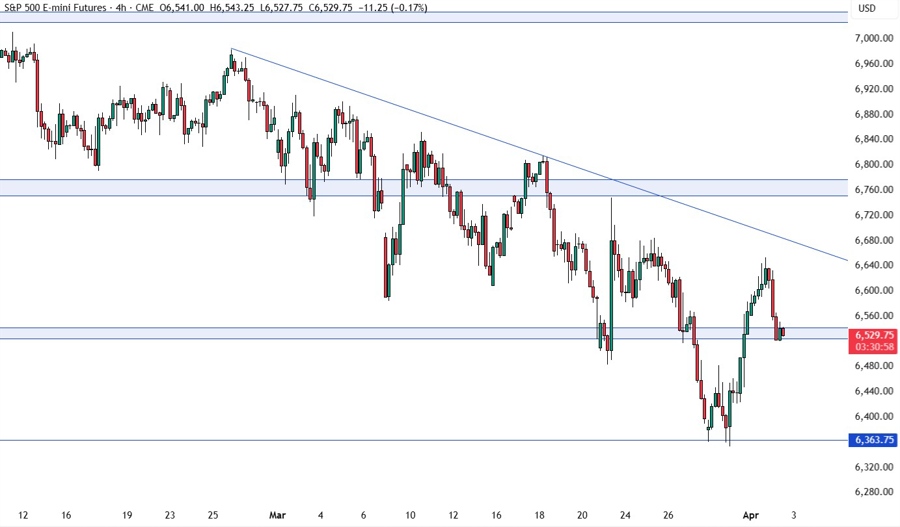
On the 4 hour chart, there’s not much we can glean from this timeframe as the buyers will look for a bounce on the support, while the sellers will wait for a break. We need to zoom in to see some more details.
S&P 500 TECHNICAL ANALYSIS – 1 HOUR TIMEFRAME
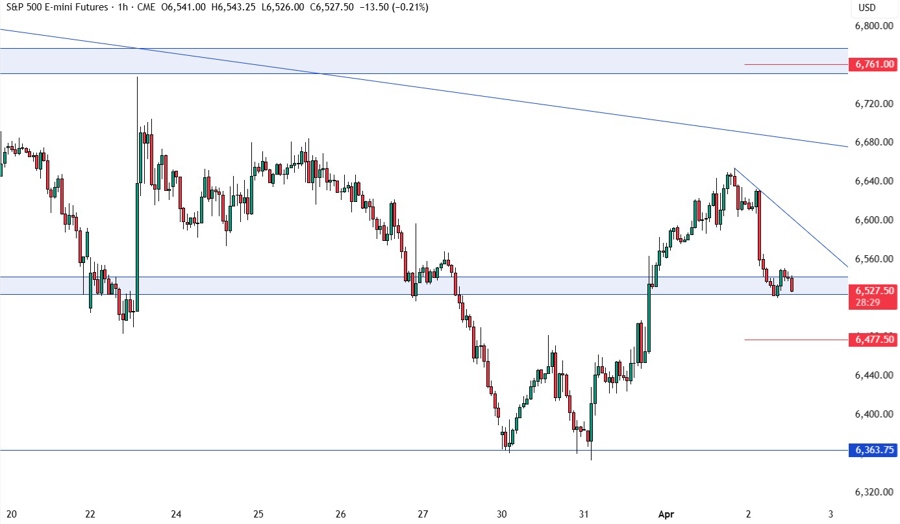
On the 1 hour chart, we have a minor downward trendline defining the bearish move. If we get a pullback into the trendline, we can expect the sellers to lean on it with a defined risk above it to keep pushing into new lows. The buyers, on the other hand, will look for a break higher to increase the bullish bets into the major trendline around the 6,670 level. The red lines define average daily range for today.
UPCOMING CATALYSTS
Today we get the latest US Jobless Claims figures. Tomorrow, we conclude the week with the US NFP report.


