
FUNDAMENTAL OVERVIEW
The S&P 500 rallied hard yesterday as Trump announced that he reached a “framework” of a deal for Greenland and that he won’t go ahead with tariffs. This is the classic TACO trade we’ve been all waiting for.
Now that this risk is out of the way, and barring new geopolitical escalations, we should have a clear path to new all-time highs. The focus should now switch back to economic data and the Fed.
Some hawkish repricing on strong US data could weigh on the market in the short-term, but those will likely be dip-buying opportunities as long as there’s no re-acceleration in inflation.
S&P 500 TECHNICAL ANALYSIS – DAILY TIMEFRAME
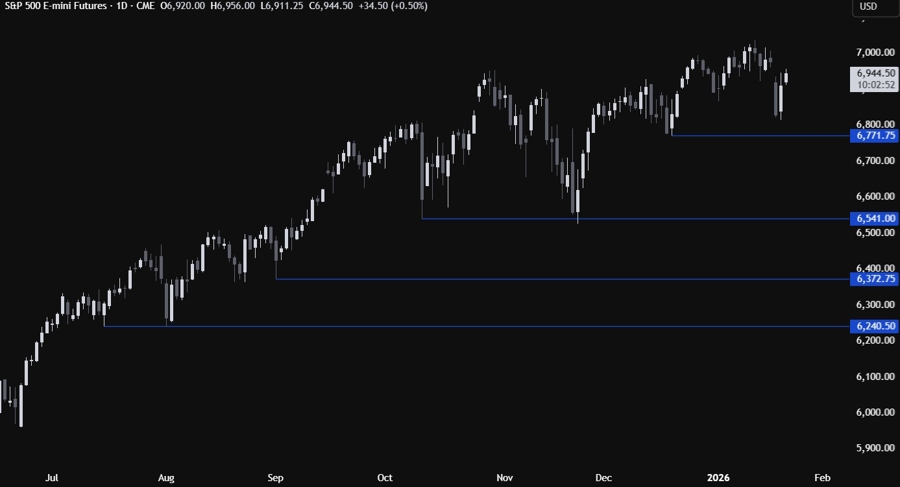
On the daily chart, we can see that the S&P 500 closed the Monday gap as the market rallied hard after Trump’s de-escalation. There’s not much we can glean from this timeframe, so we need to zoom in to see some more details.
S&P 500 TECHNICAL ANALYSIS – 4 HOUR TIMEFRAME
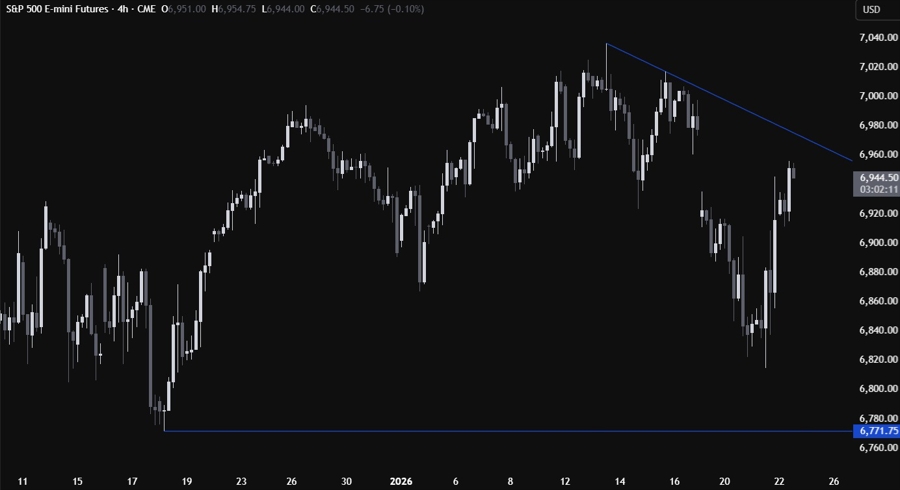
On the 4 hour chart, we can see that we have a downward trendline defining the bearish momentum. We can expect the sellers to lean on the trendline with a defined risk above it to keep pushing into new lows. The buyers, on the other hand, will look for a break higher to increase the bullish bets into new highs.
S&P 500 TECHNICAL ANALYSIS – 1 HOUR TIMEFRAME
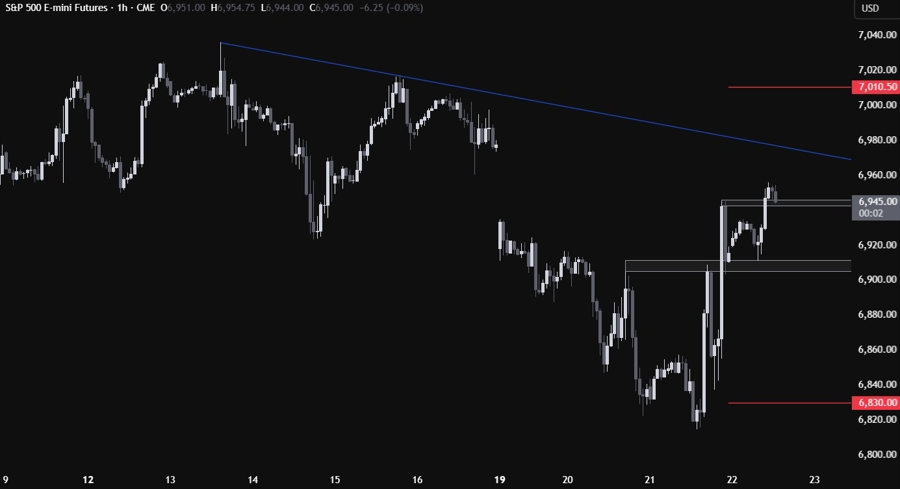
On the 1 hour chart, we can see that we have a minor support zone around the 6,945 level. This is where we can expect the buyers to step in with a defined risk below the support to keep pushing into new highs. The sellers, on the other hand, will look for a break lower to extend the pullback into the next support around the 6,910 level. The red lines define the average daily range for today.
UPCOMING CATALYSTS
Today we get the latest US Jobless Claims figures, while tomorrow we conclude the week with the US Flash PMIs.
