
FUNDAMENTAL OVERVIEW
The Nasdaq has been consolidating since Monday as traders awaited the US NFP and CPI reports this week. We got the NFP yesterday and it was a hot one as it beat expectations by a big margin with the unemployment rate falling further to 4.3% despite an increase in participation rate.
The market reacted positively even though we got a slightly hawkish repricing as traders pared back the total easing seen by year-end from 60 bps to 53 bps after the release. This is in line with the current regime of good news being good news as long as inflation continues to slowly head towards target.
Tomorrow, we will have an important test as we get the US CPI report. In case we get soft data, we will likely see the stock market rallying into the all-time highs amid stabilising labour market and easing inflation. On the other hand, a hot report will likely trigger a stronger hawkish repricing and weigh on the market in the short-term.
NASDAQ TECHNICAL ANALYSIS – DAILY TIMEFRAME
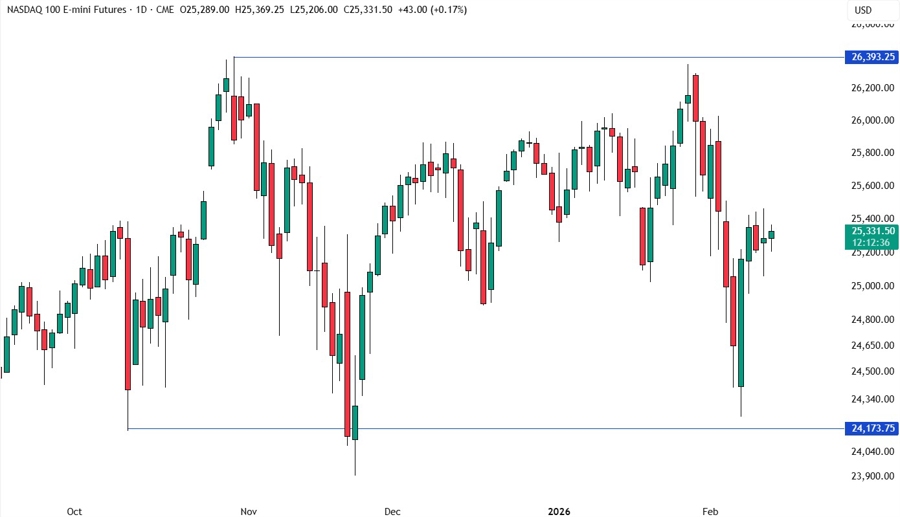
On the daily chart, we can see that after the bounce near the October lows, the Nasdaq got stuck in a consolidation around the 25,400 level. The price is trading right in the middle of the range, so there’s not much we can glean from this timeframe and we need to zoom in to see some more details.
NASDAQ TECHNICAL ANALYSIS – 4 HOUR TIMEFRAME
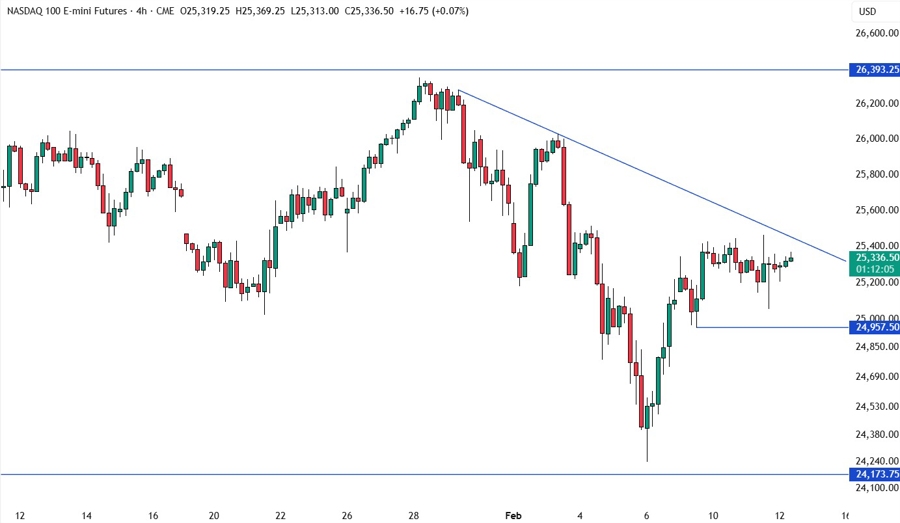
On the 4 hour chart, we can see a downward trendline defining the bearish momentum. The sellers will likely lean on the trendline with a defined risk above it to position for a drop back into the February lows. The buyers, on the other hand, will look for a break higher to increase the bullish bets into new all-time highs.
NASDAQ TECHNICAL ANALYSIS – 1 HOUR TIMEFRAME
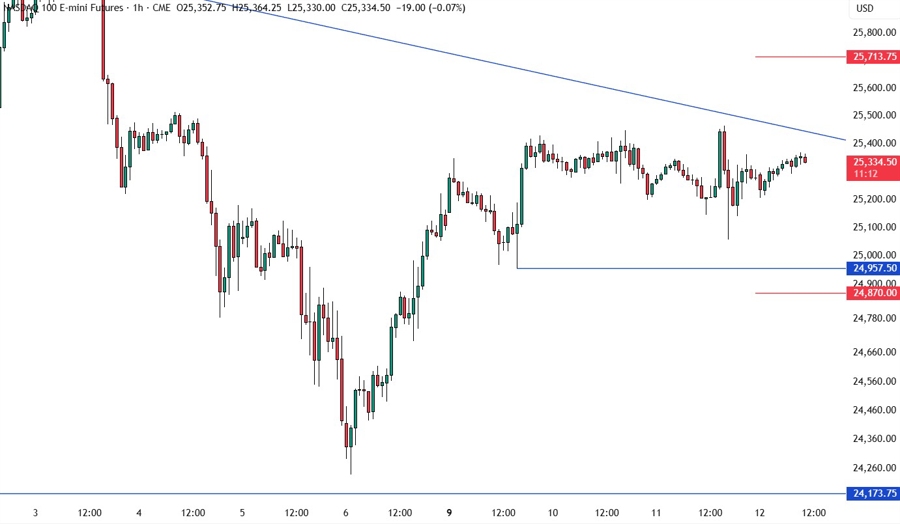
On the 1 hour chart, we can see more clearly the rangebound price action just below the 25,400 level. The buyers will likely pile in on the break of the trendline or on a retest of the 24,957 low to target new all-time highs. The sellers, on the other hand, will likely step in around the trendline and increase the bearish bets on the break of the 24,957 low to position for a drop into the February lows. The red lines define the average daily range for today.
UPCOMING CATALYSTS
Today we get the US Jobless Claims figures, while tomorrow we conclude the week with the US CPI report.


