
FUNDAMENTAL OVERVIEW
The Nasdaq is finding some footing today as WSJ reported that Trump would be open to end the war without pushing for a reopening of the Strait of Hormuz. That would be great news for the markets as the Iranians will likely reopen the Strait as soon as the US forces withdraw.
We will need Trump to announce that though as the only thing we got till now were speculations and empty words aimed at jawboning the markets. Trump is certainly very uneasy right now with the stock market making new lows, much higher Treasury yields, triple digit oil prices and the Fed in a "wait and see" mode.
This ugly mix should pressure him for a quick resolution as failure to do so would highly likely lead to a recession before the midterms. The “ceasefire” expires on April 6 and Trump mentioned that he’d like to have a deal before that date, so keep a close eye on the headlines and especially on his Truth Social account.
For now, the path of least resistance remains to the downside until we get a resolution.
NASDAQ TECHNICAL ANALYSIS – DAILY TIMEFRAME
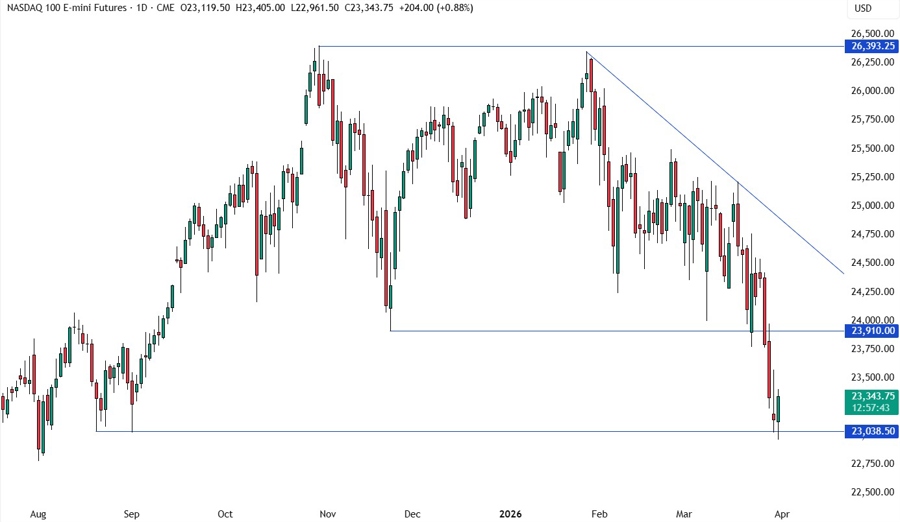
On the daily chart, we can see that the Nasdaq eventually dropped to the 23,000 level before bouncing. The buyers stepped in there with a defined risk below the level to position for a pullback into the 23,910 resistance. The sellers will want to see the price breaking lower to increase the bearish bets into new lows.
NASDAQ TECHNICAL ANALYSIS – 4 HOUR TIMEFRAME
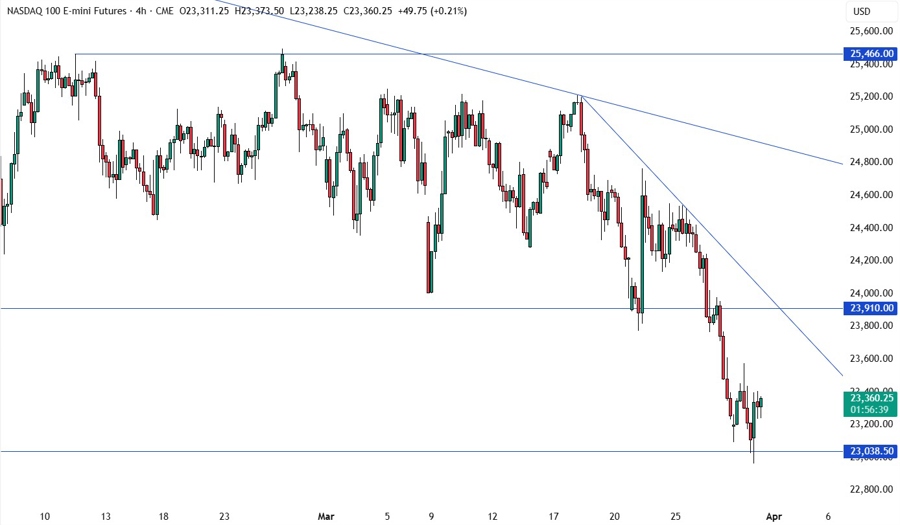
On the 4 hour chart, we have a downward trendline defining the bearish momentum. If we get a pullback, we can expect the sellers to lean on the trendline with a defined risk above it to keep pushing into new lows. The buyers, on the other hand, will look for a break higher to increase the bullish bets into the major downward trendline around the 24,700 level next.
NASDAQ TECHNICAL ANALYSIS – 1 HOUR TIMEFRAME
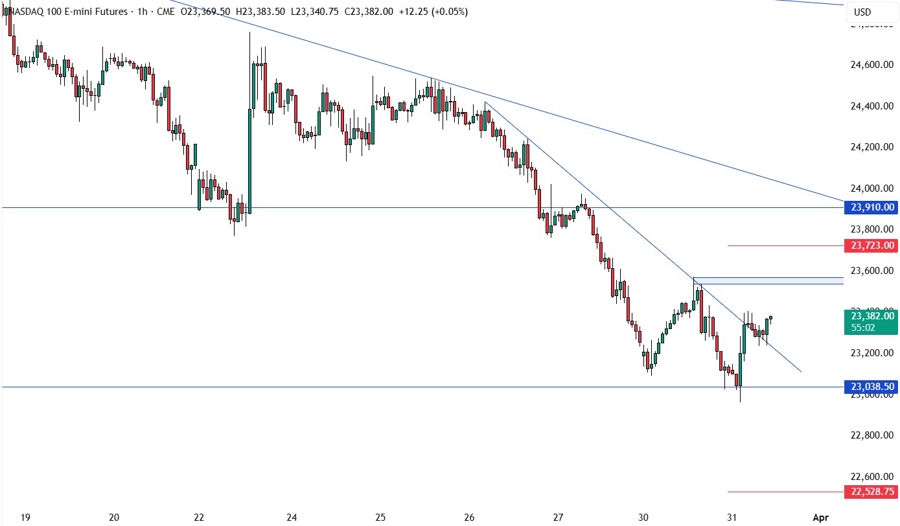
On the 1 hour chart, the price broke above the minor downward trendline which was defining the bearish momentum on this timeframe. The buyers piled in on the break targeting a pullback into the 23,910 level. The sellers, on the other hand, will have a better risk to reward setup around the 23,550 swing level to position for a drop into new lows. The red lines define average daily range for today.
UPCOMING CATALYSTS
Today we get the US Consumer Confidence and US Job Openings data. Tomorrow, we have the US ADP, the US Retail Sales and the US ISM Manufacturing PMI. On Thursday, we get the latest US Jobless Claims figures. On Friday, we conclude the week with the US NFP report.


