
Fundamental Overview
The uncertainty about a December cut has been putting a lid on further stock market gains. The probability for a December cut is now a bit below 50%. It’s still basically a 50/50 chance, but we will likely need soft labour market or inflation data to get the Fed to cut at the upcoming meeting.
In fact, there’s a strong debate within the FOMC whether a December cut is warranted at this point. The data will have the final say, and the decision-maker will likely be the November NFP expected to be released in the first week of December just a few days before the FOMC meeting.
Strong data is likely to weigh on the market on a further hawkish repricing, while soft data should give the market a boost as rate cut hopes would increase.
S&P 500 Technical Analysis – Daily Timeframe
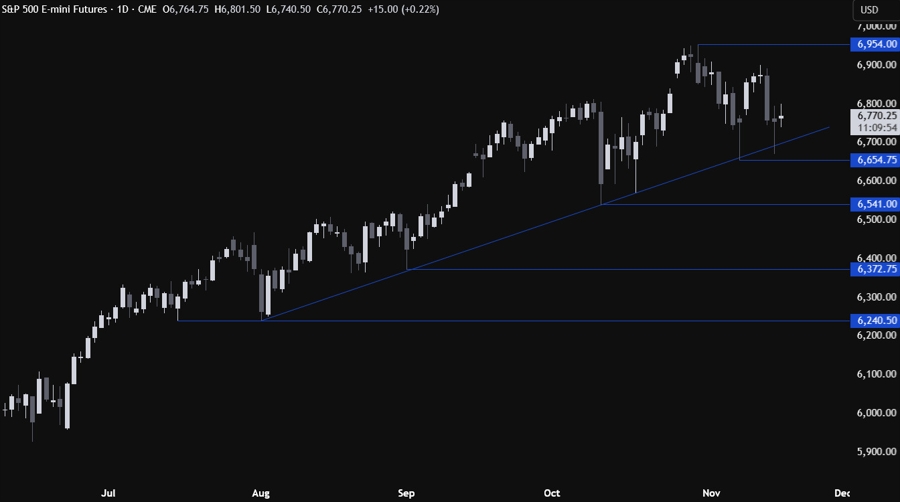
On the daily chart, we can see that the S&P 500 bounced once again around the major trendline. If we get another drop, we can expect the dip-buyers to step in there again with a defined risk below the low to position for a rally into new all-time highs. The sellers, on the other hand, will want to see the price breaking lower to increase the bearish bets into the 6,541 level next.
S&P 500 Technical Analysis – 4 hour Timeframe
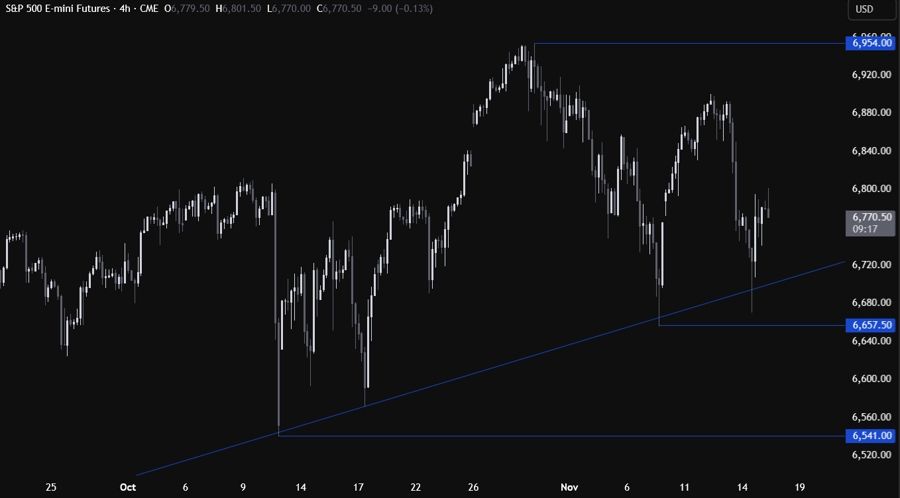
On the 4 hour chart, there’s not much we can glean from this timeframe as we don’t have clear levels where to lean onto other than the above mentioned major trendline, so we need to zoom in to see some more details.
S&P 500 Technical Analysis – 1 hour Timeframe

On the 1 hour chart, we can see that we have a minor support zone around the 6,745 level. If the price pulls back into the support, we can expect the buyers to step in there with a defined risk below the support to position for a rally into the 6,900 level next. The sellers, on the other hand, will look for a break lower to increase the bearish bets into the major trendline targeting a breakout. The red lines define the average daily range for today.
Upcoming Catalysts
Tomorrow we get the weekly ADP jobs data. On Wednesday, we have the FOMC meeting minutes. On Thursday, we get the September NFP report and maybe the US Jobless Claims data. On Friday, we conclude the week with the US Flash PMIs.
