
Fundamental Overview
The US CPI yesterday came mostly in line with expectations and wasn’t strong enough to force a reassessment on a September cut. In fact, the pricing for the Fed actually increased from 57 bps of easing by year-end to 61 bps after the US CPI report.
The majority of Fed voters are also on board for a cut in September so now we will likely need a hot NFP to reduce the probabilities towards the 50% chance, although it's more likely that the market will just price out the chances for the future cuts.
The focus now switches to Fed Chair Powell's speech at the Jackson Hole Symposium, although he will likely either join his colleagues or just repeat that they will decide based on the totality of the data.
For the stock market, this is all good news as the Fed’s dovish reaction function despite a resilient economy, keeps growth expectations skewed to the upside favouring the bullish trend. This is a train that can’t be stopped unless the Fed changes its stance (opening the door for hikes) or we get some negative growth event like we’ve seen in April.
S&P 500 Technical Analysis – Daily Timeframe
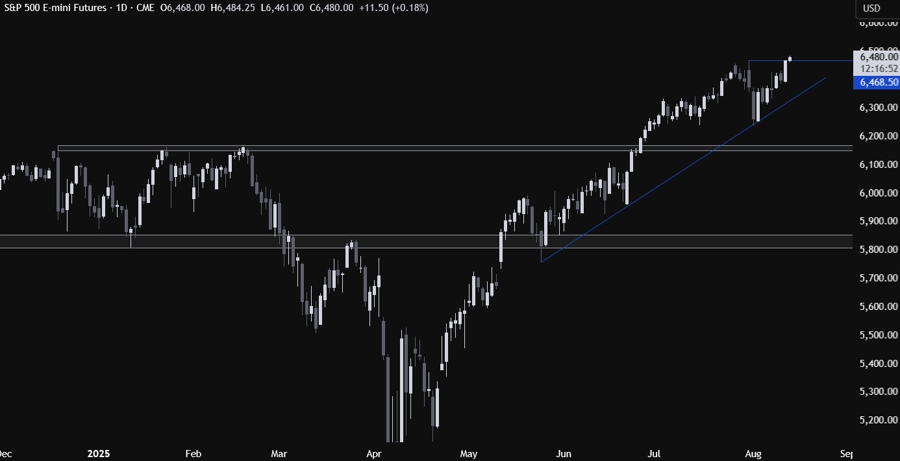
On the daily chart, we can see that the S&P 500 extended the gains into new all-time highs as the FOMO is now kicking in. From a risk management perspective, the buyers will definitely have a better risk to reward setup around the trendline to position for further upside, but we will need a big pullback for that which is not expected at least until September. For the sellers, a break below the trendline would open the door for an even deeper pullback into the 6,160 level.
S&P 500 Technical Analysis – 4 hour Timeframe
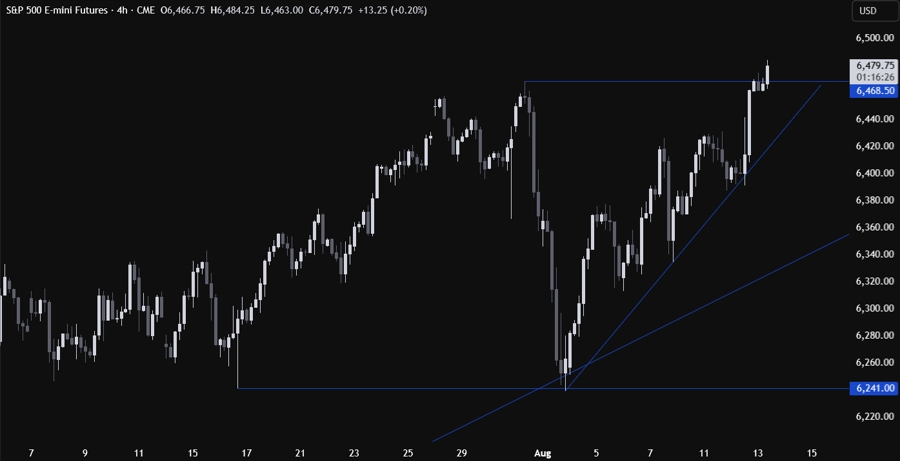
On the 4 hour chart, we can see that we have a minor trendline defining the bullish momentum on this timeframe. We just got a bounce from it yesterday following the US CPI report, and the price is now trading just above the previous all-time high.
The buyers will likely pile in around these levels with a defined risk below the previous all-time high to position for further upside. The sellers, on the other hand, will look for a break lower to target a pullback into the minor trendline.
S&P 500 Technical Analysis – 1 hour Timeframe
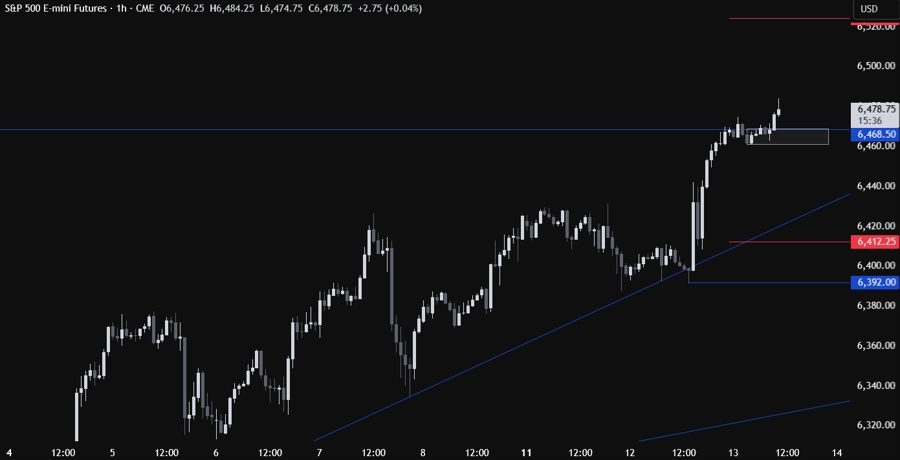
On the 1 hour chart, we can see more clearly the recent price action although there’s not much we can add here. The 6,460-6,475 area should act as support, so if we get a pullback into it, we can expect the buyers to step in to target new highs, while the sellers will look for a break lower to target a drop into the trendline. The red lines define the average daily range for today.
Upcoming Catalysts
Tomorrow we get the US PPI and the US Jobless Claims figures. On Friday, we conclude the week with the US Retail Sales and the University of Michigan Consumer Sentiment report. Focus also on Fedspeak, especially after yesterday's US CPI data.
Visit investingLive.com (formerly ForexLive.com) for real-time news coverage and more technical analysis articles
