Fundamental Overview
The hawkish repricing triggered by Fed Chair Powell’s uncertainty on a December cut coupled with the intensifying overnight funding pressure due to prolonged government shutdown weighed on the stock market in the last week.
The market bounced strongly on the expectations of the end of the shutdown on Friday and extended the gains this week as the expectations grew stronger. The S&P 500 has now basically erased all the losses experienced last week.
Looking ahead, the end of the shutdown will finally bring back the key US data like the NFP and CPI, and those are going to be key risk events for the market ahead of the FOMC decision in December. As a reminder, there’s a strong debate within the FOMC whether a December cut is warranted at this point. The data will have the final say.
Strong data is likely to weigh on the market on a further hawkish repricing, while soft data should give the market a boost as rate cut bets would increase.
S&P 500 Technical Analysis – Daily Timeframe
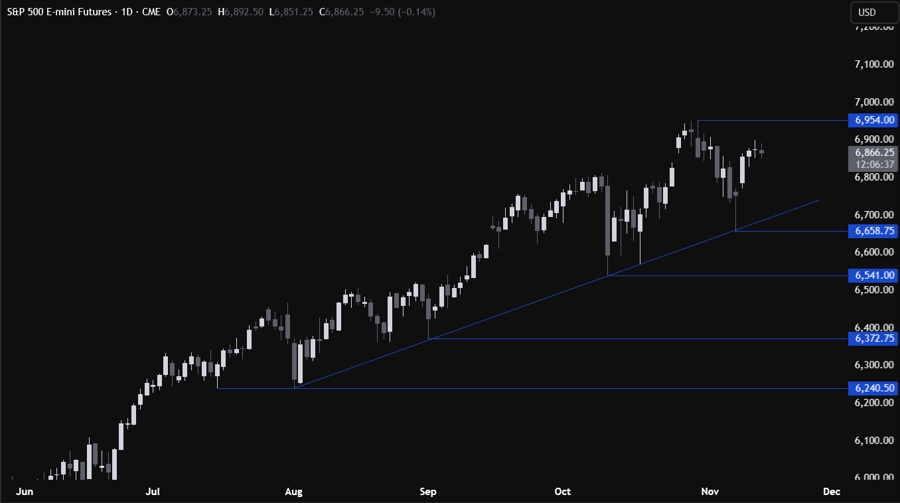
On the daily chart, we can see that the S&P 500 bounced right at the major trendline and extended the gains this week as the end of the shutdown drew near. The target for the buyers is of course a new all-time high but we can expect the sellers to step in around the all-time highs with a defined risk above to position for a drop back into the major trendline.
S&P 500 Technical Analysis – 4 hour Timeframe
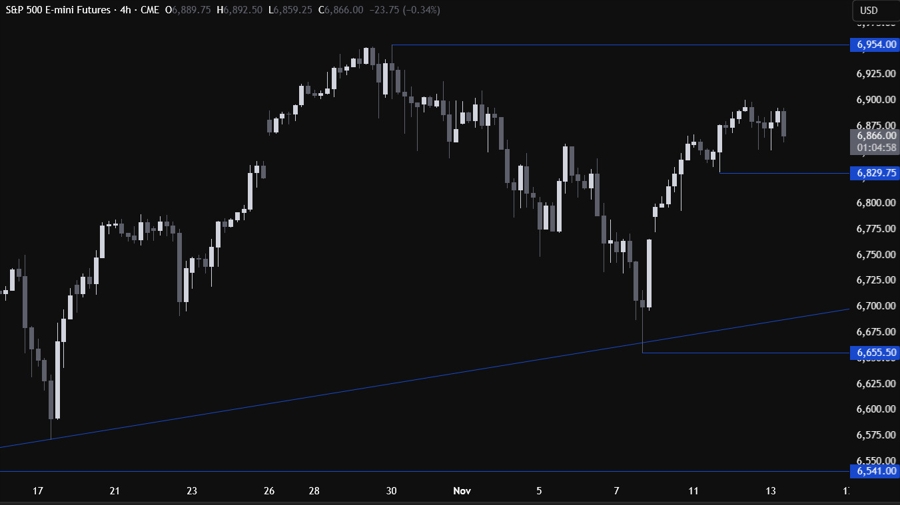
On the 4 hour chart, we can see that the bullish momentum eased recently as the price action became more rangebound. We have the most recent swing low around the 6,830 level and that’s where we can expect the buyers to step in with a defined risk below the level to position for a rally into a new all-time high. The sellers, on the other hand, will want to see the price breaking lower to pile in for a drop back into the major trendline.
S&P 500 Technical Analysis – 1 hour Timeframe
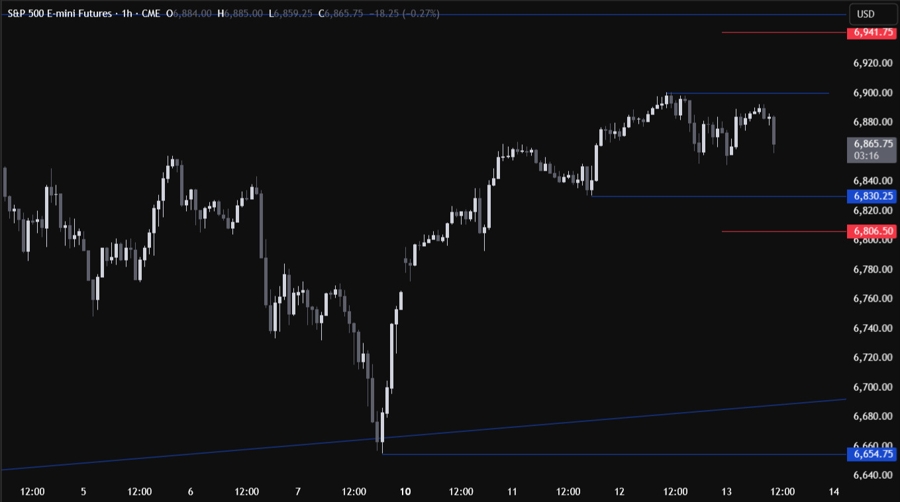
On the 1 hour chart, there’s not much else we can add here but if we don’t get a pullback into the swing low, we can expect the buyers to increase the bullish bets on the break above the recent high at 6,900. The red lines define the average daily range for today.


