
KEY POINTS:
- US unemployment rate surprises to the upside
- Higher probabilities we see another Fed rate cut sooner than expected
- The stock market remains supported by the Fed's dovish reaction function
- US CPI coming up tomorrow
FUNDAMENTAL OVERVIEW
We finally got the most recent US jobs report yesterday, and the data surprised to the downside. In fact, despite the headline number slightly beating expectations, the more important unemployment rate jumped to 4.6% vs 4.4% prior.
There were some positives as the permanent job losers rate was a bit lower, but the main takeaway is that the trend remains to the upside and that the unemployment rate was higher than the Fed’s year-end forecast.
Fed Chair Powell made it pretty clear in his last press conference that they are more focused on the labour market weakness, and they can tolerate some higher inflation given the transitory expectations.
This suggests that we could see another rate cut sooner than expected. The market might start to price that in with more conviction if tomorrow’s US CPI data doesn’t overshoot. This should be supportive for the stock market and we could get the Santa Rally with new all-time highs before year-end.
S&P 500 TECHNICAL ANALYSIS – DAILY TIMEFRAME
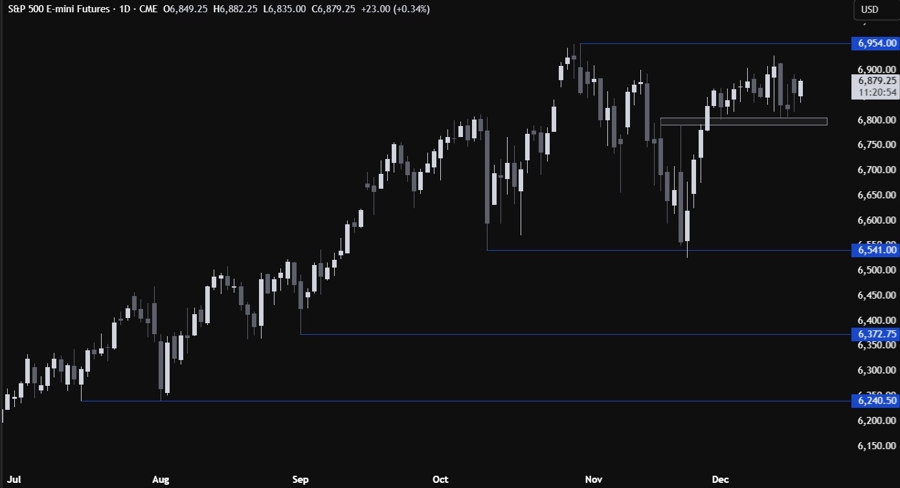
On the daily chart, we can see that the S&P 500 bounced from the key support zone around the 6800 level.
The buyers stepped in with a defined risk below the support to position for a rally into a new all-time high.
The sellers will need the price to break below the support to open the door for a bigger correction back into the October lows.
S&P 500 TECHNICAL ANALYSIS – 4 HOUR TIMEFRAME
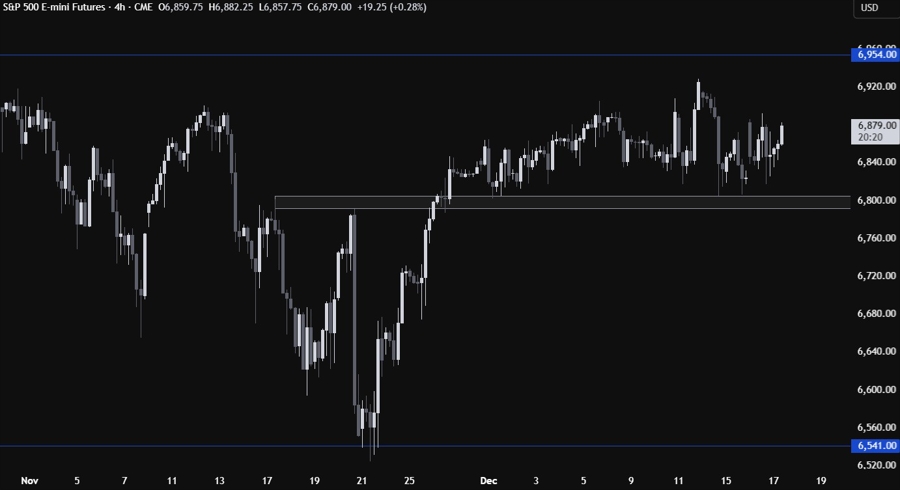
On the 4 hour chart, we can see more clearly the recent rangebound price action with the downside limited by the 6800 support.
There’s not much we can glean from this timeframe, but if the price were to come back down to the support, we can expect the buyers to step in again to keep pushing into new highs.
The sellers, on the other hand, will need a downside breakout to start targeting the 6541 level next.
S&P 500 TECHNICAL ANALYSIS – 1 HOUR TIMEFRAME
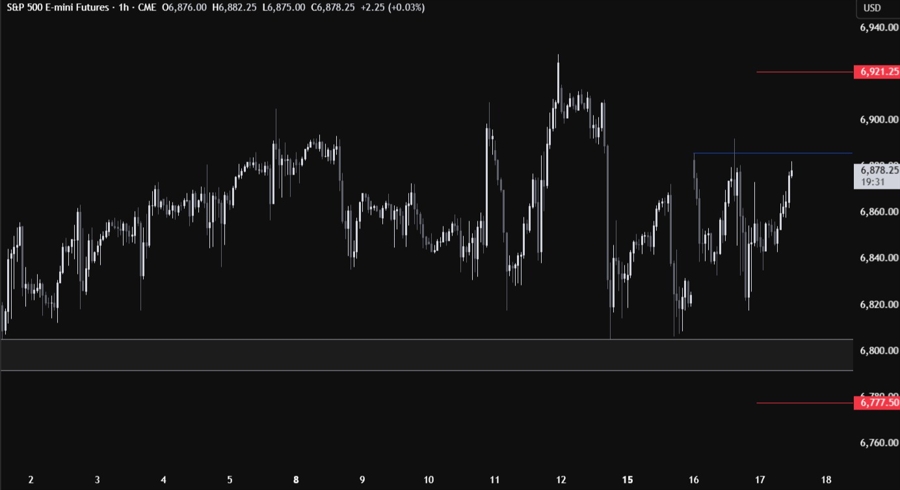
On the 1 hour chart, we can see that we have a minor resistance around the 6885 level. The sellers will likely continue to step in there, with a defined risk above the most recent high, to position for a move back into the 6800 support.
The buyers, on the other hand, will look for a break higher to increase the bullish bets into a new all-time high. The red lines define the average daily range for today.
UPCOMING CATALYSTS
Tomorrow we get the US CPI report.


