Fundamental Overview
The S&P 500 recovered all the losses as the de-escalation that ensued soon after Trump’s threat of massively increasing tariffs on China gave the bulls a good reason to keep piling into the market.
The baseline expectation is for US and China to reach some kind of a deal before the November 1st deadline. If that doesn’t happen, then we can expect the deadline to be postponed keeping the negotiations going.
Everybody knows that 155% tariffs on China would be a suicide for both, so it’s kind of an empty threat. Nevertheless, we could still see the markets selling off in case things go south and Trump decides to impose those tariffs. It’s a very low risk, but still a risk.
On Friday, the BLS will release the US CPI report despite the shutdown since it’s crucial for social security benefits adjustment required by November. The data won’t stop the Fed from cutting rates in October, but it could trigger a hawkish repricing in case we get an upside surprise.
S&P 500 Technical Analysis – Daily Timeframe
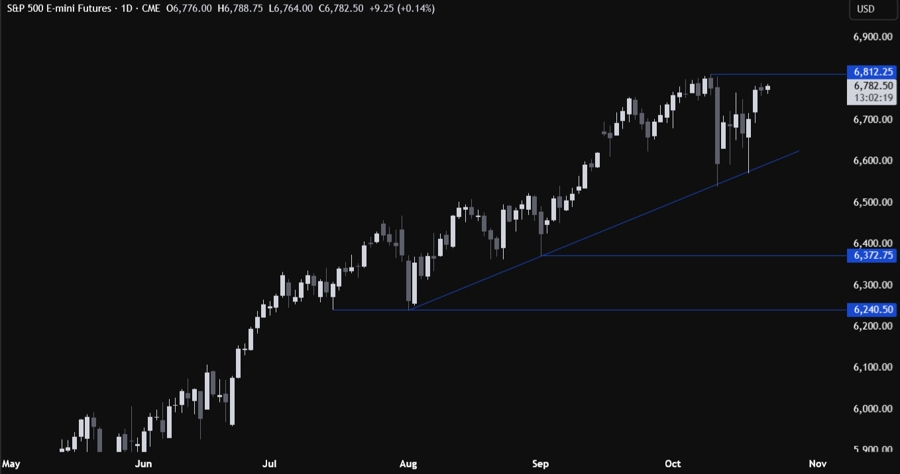
On the daily chart, we can see that the S&P 500 bounced around the major trendline a couple of times and eventually rallied back into the recent highs. We can expect the sellers to step in around these levels with a defined risk above the all-time high to position for a drop back into the trendline. The buyers, on the other hand, will want to see the price breaking higher to increase the bullish bets into the 7,000 level next.
S&P 500 Technical Analysis – 4 hour Timeframe
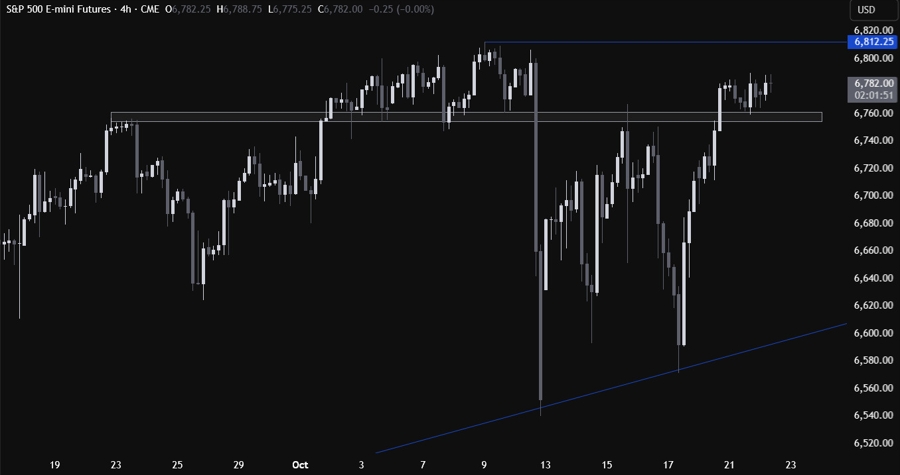
On the 4 hour chart, we can see that we have a key support zone around the 6,760 level where the price got rejected from several times in the past weeks. We can expect the buyers to continue to lean on that support with a defined risk below it to keep pushing into new highs, while the sellers will look for a break lower to target a pullback into the major trendline.
S&P 500 Technical Analysis – 1 hour Timeframe
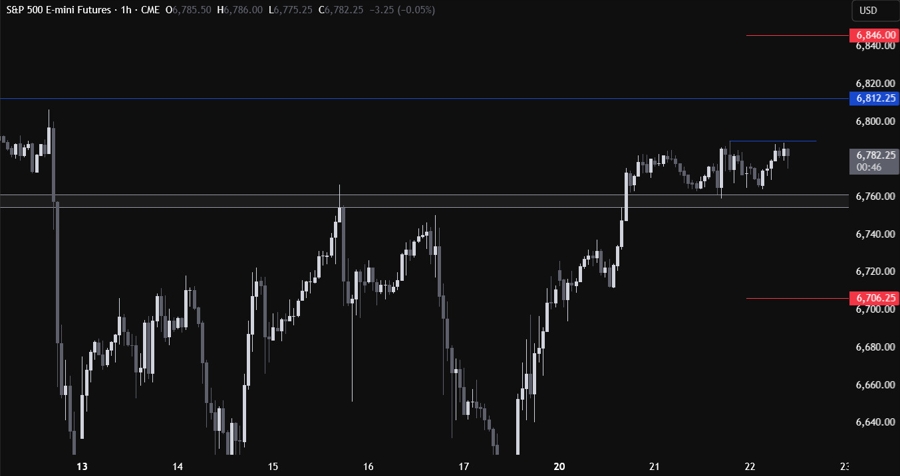
On the 1 hour chart, there’s not much else we can add here as the buyers would be better off stepping in around the support, while the sellers should wait for a downside breakout. The red lines define the average daily range for today.
Upcoming Catalysts
On Friday, we will get the US CPI report and the US flash PMIs.
