
KEY POINTS:
- US CPI surprises to the downside, potentially opening the door for an earlier than expected rate cut
- US Jobless Claims disagree with NFP report. We'll get a clearer picture next month.
- Key technical levels are limiting the upside. Traders are waiting for breakouts.
FUNDAMENTAL OVERVIEW
The US CPI yesterday surprised to the downside across the board, but as we’ve seen with the NFP report, the market took the data with a pinch of salt. The S&P 500 strengthened following the CPI release but eventually gave back some of the gains as the bullish momentum faded.
It should also be noted that we got the US Jobless Claims yesterday and the data was strong. The Initial Claims remain around the same low levels we got used to for years, but Continuing Claims dropped to the lowest level since May.
The main takeaway is that the recent data shows gradual cooling in the labour market, with inflation undershooting Fed’s forecasts. Fed Chair Powell made it pretty clear in his last press conference that they are more focused on the labour market weakness, and they can tolerate some higher inflation given the transitory expectations.
This suggests that we could see another rate cut sooner than expected, especially if the recent data gets validated next month. The market should start to move into that direction with new all-time highs likely being in the cards.
S&P 500 TECHNICAL ANALYSIS – DAILY TIMEFRAME

On the daily chart, we can see that the S&P 500 probed below the key support zone around the 6800 level but eventually bounced back strongly. The buyers piled in as soon as the price rose back above the 6800 level with a defined risk below it to target new all-time highs. The sellers will need the price to break below the support to open the door for a bigger correction into the October lows.
S&P 500 TECHNICAL ANALYSIS – 4 HOUR TIMEFRAME

On the 4 hour chart, we can see that we have a downward trendline defining the recent pullback into the 6800 support. The price got rejected yesterday but it’s now coming back to retest the trendline. The sellers will likely continue to lean on the trendline to keep targeting a break below the 6800 support, while the buyers will look for a break higher to increase the bullish bets into a new all-time high.
S&P 500 TECHNICAL ANALYSIS – 1 HOUR TIMEFRAME
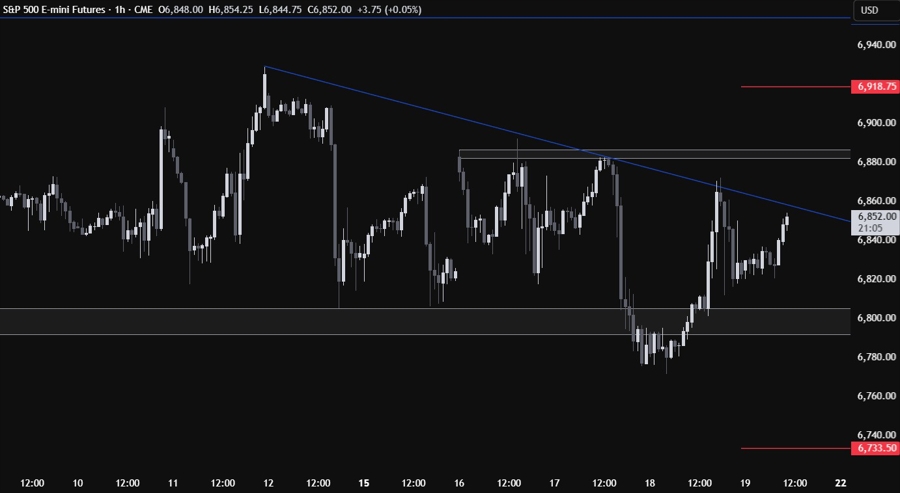
On the 1 hour chart, we can see that we have a minor resistance around the 6885 level. In case we break above the trendline, the resistance will likely be the last level of defence for the sellers as a break above it should open the door for new all-time highs. The red lines define the average daily range for today.


