Fundamental Overview
The uncertainty about a December cut has been weighing on the stock market ever since Powell delivered his infamous line saying that a December cut was not a foregone conclusion. The lack of official US data and cautious stance from Fed members didn’t help either.
On Friday though, Fed’s Williams suggested that he would support a rate cut in December and the market pricing jumped immediately to 60%, giving the stock market a boost. As things stand, a rate cut in December is now more likely and that should support the stock market heading into the meeting.
Moreover, we got also the news that Trump administration was considering selling the H200 Nvidia chips to China, which was another positive catalyst for the market.
This week, we have a holiday-shortened week due to Thanksgiving on Thursday, but we will still get two important economic data like the weekly ADP report tomorrow and the most recent US Jobless Claims on Wednesday.
S&P 500 Technical Analysis – Daily Timeframe

On the daily chart, we can see that the S&P 500 bounced from the key swing point around the 6,541 level. The buyers stepped in there with a defined risk below the lows to position for a rally back into the all-time highs. The sellers, on the other hand, will want to see the price breaking lower to increase the bearish bets into the 6,372 level next.
S&P 500 Technical Analysis – 4 hour Timeframe
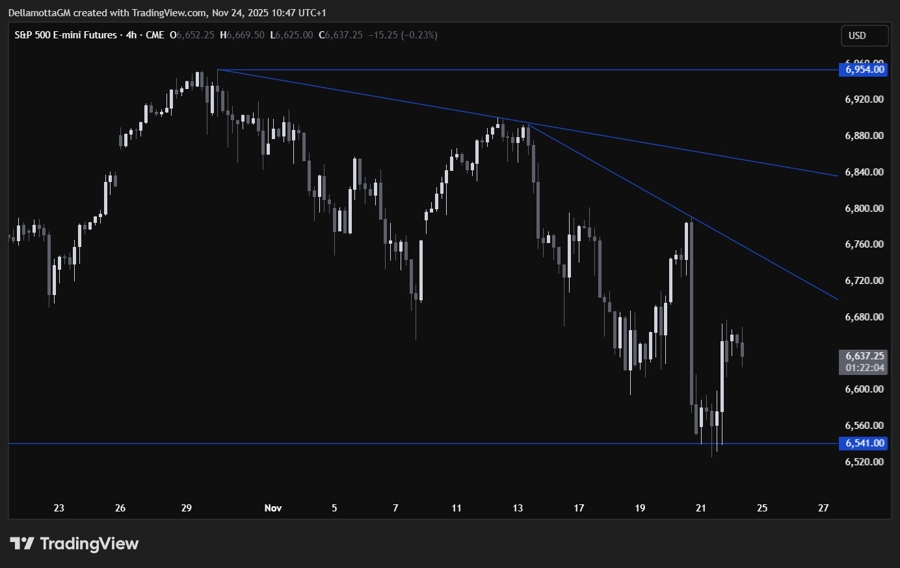
On the 4 hour chart, we can see that we have a downward trendline defining the bearish momentum. If we get a pullback into the trendline, we can expect the sellers to lean on it with a defined risk above it to position for a drop into new lows. The buyers, on the other hand, will look for a break higher to increase the bullish bets into the next trendline around the 6,840 level.
S&P 500 Technical Analysis – 1 hour Timeframe
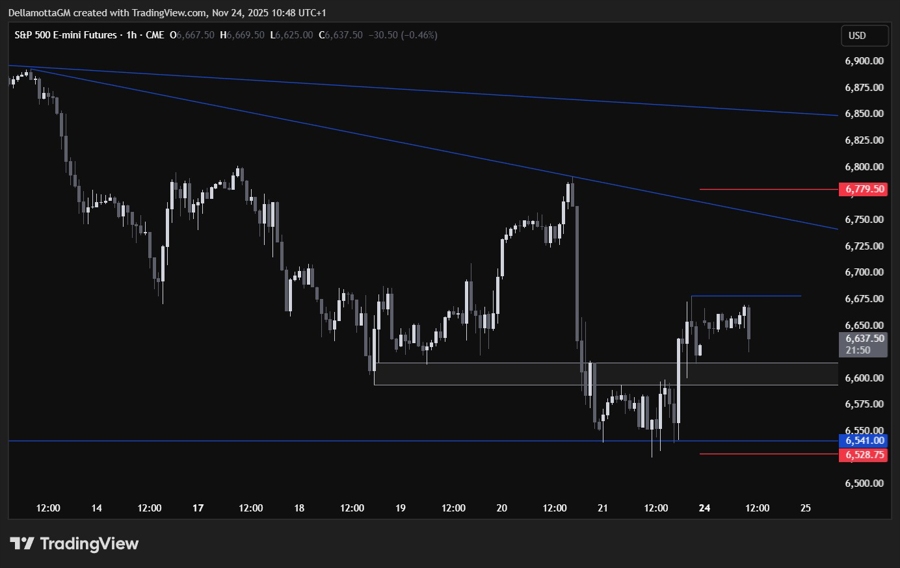
On the 1 hour chart, we can see that we have a minor support zone around the 6,600 level. If the price gets there, we can expect the buyers to step in with a defined risk below the support to position for a rally into the trendline. The sellers, on the other hand, will look for a break lower to pile in for a drop into new lows. The red lines define the average daily range for today.
Upcoming Catalysts
Tomorrow we get the weekly ADP jobs data and the US Consumer Confidence report. We will also get the September US PPI and Retail Sales reports. On Wednesday, we get the most recent US Jobless Claims figures and the September Durable Goods Orders report. On Thursday, we have the US Thanksgiving holiday, so the final part of the week will likely see a rangebound market.
