
Fundamental Overview
The S&P 500 continues to recover the losses experienced on Friday following Trump’s threat of increasing tariffs by 100% on China in response to the recent Chinese imposition of export controls on rare earth minerals.
Over the weekend, we got more soothing words from Trump and other US officials that eventually led to a big upside gap at the open. The gap was then filled following a bit more aggressive comments from US Treasury Secretary Bessent and some Chinese countermeasures on port fees.
Yesterday, US Trade Representative Greer repeated mostly the same stuff that we’ve already heard over the weekend but added two important comments as he mentioned that they are watching the stock and bond markets and that they want to make sure the market responds to appropriate info.
This sounds like they don't want the market to think this is going to be another April. They want the market to keep expecting a de-escalation, which has indeed been the case since the weekend. Even Trump’s late post threatening a termination of cooking oil business with China sounded like a very weak move.
This suggests a limited pain threshold by the US administration which shouldn't be surprising given the overstretched positioning in the stock markets. The Friday's selloff was so aggressive for this reason. So, if things go south between now and November 1, then we could indeed have another April-like selloff. For now, the downside is limited by the de-escalatory expectations.
S&P 500 Technical Analysis – Daily Timeframe
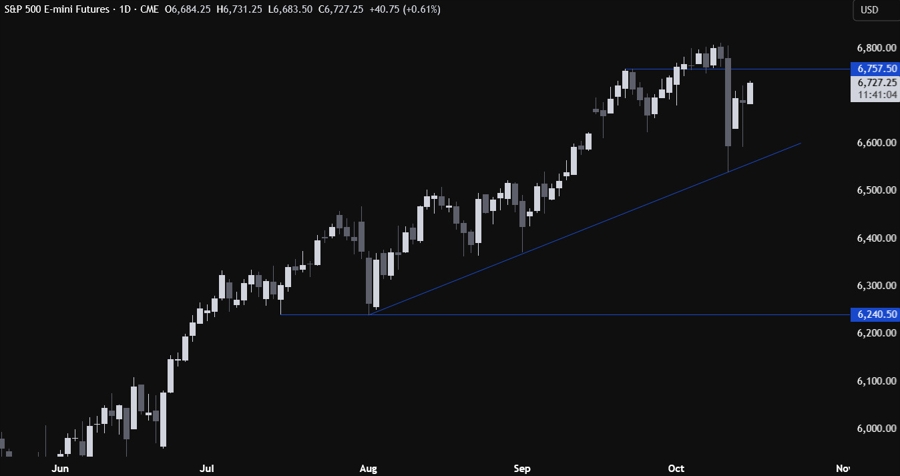
On the daily chart, we can see that the S&P 500 pulled all the way back to the major trendline around the 6,542 level and it’s now recovering into the key 6,757 level. This is where we can expect the sellers to step in with a defined risk above the level to position for another drop into the trendline. The buyers, on the other hand, will want to see the price breaking higher to increase the bullish bets into a new all-time high.
S&P 500 Technical Analysis – 4 hour Timeframe
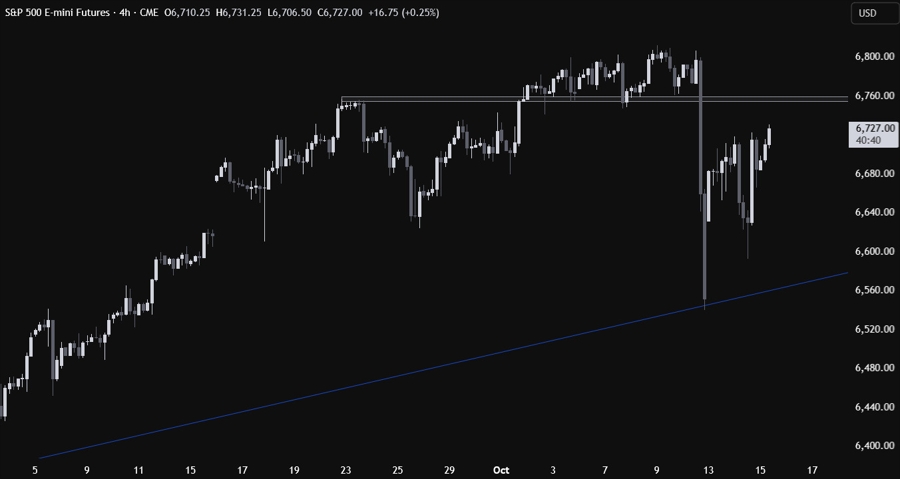
On the 4 hour chart, we can see more clearly the resistance zone around the 6,757 level and the recent choppy price action. There’s not much else we can glean from this timeframe, so we need to zoom in to see some more details.
S&P 500 Technical Analysis – 1 hour Timeframe
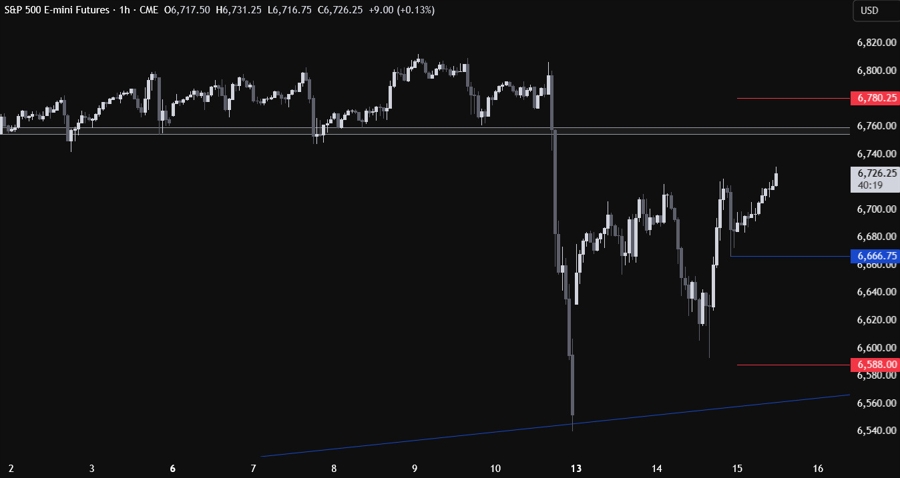
On the 1 hour chart, if we get a pullback from the resistance, we can expect the buyers to step in around the most recent swing low at 6,666. In case the price breaks through that level though, we can expect the drop to extend into the lows around the 6,600 level as the sellers will likely pile in more aggressively. The red lines define the average daily range for today.
Upcoming Catalysts
We don’t have key data releases this week given the US government shutdown. The Fed speakers continue to repeat the same old stuff. As of now, we know that only the US CPI will be published despite the shutdown, which is scheduled for Friday October 24. At the moment, the markets are solely focused on US-China headlines.
