FUNDAMENTAL OVERVIEW
Things were looking pretty dire for the S&P 500 just an hour ago as Trump’s ultimatum to Iran was keeping traders on edge for fears of further escalation.
That’s now history though as Trump’s ceasefire announcement on Truth Social turned markets around quickly on expectations of a potential end to the conflict.
The downside for now will likely remain limited but the risk that this is just Trump jawboning markets again might also cap the upside. In fact, the Iranian side is saying that there were no direct or indirect contacts with the US.
US-Iran headlines will continue to drive the price action, so traders will need to stay laser focused and be nimble to adjust their positions.
S&P 500 TECHNICAL ANALYSIS – DAILY TIMEFRAME
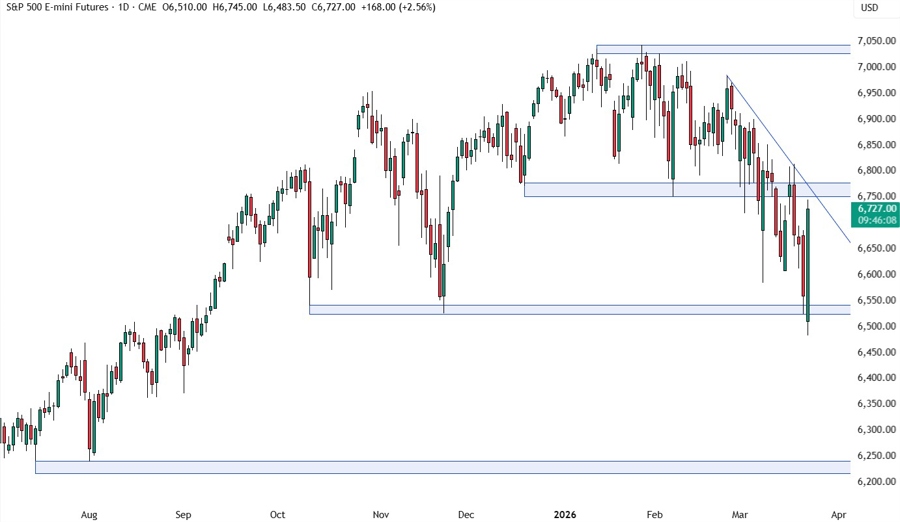
On the daily chart, we can see that the S&P 500 probed below the November lows and reversed strongly after Trump’s ceasefire. We can expect the sellers to step in around the resistance at 6,760 where we have also the confluence of the major trendline. The buyers, on the other hand, will want to see a breakout to increase the bullish bets into new all-time highs.
S&P 500 TECHNICAL ANALYSIS – 4 HOUR TIMEFRAME
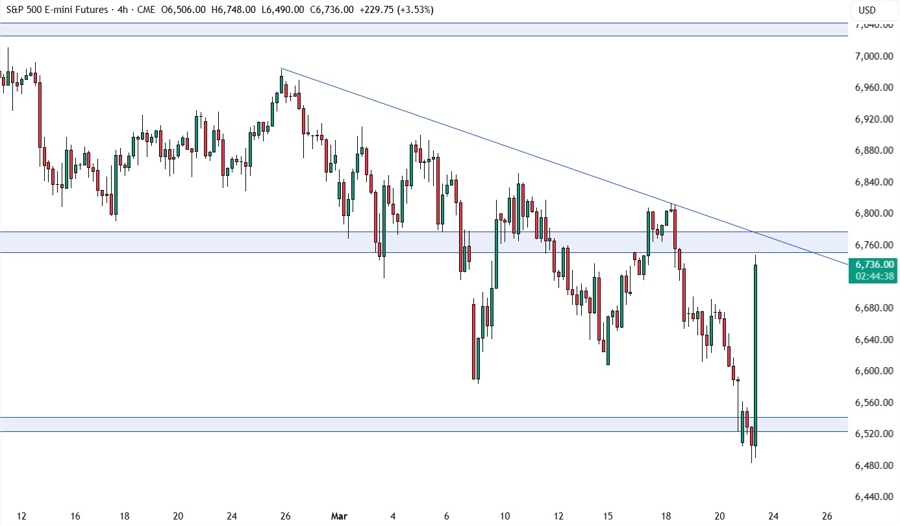
On the 4 hour chart, there’s not much we can add as the sellers will likely step in around the resistance to target a drop back into the 6,530 support, while the buyers will look for a breakout to pile in for new highs.
S&P 500 TECHNICAL ANALYSIS – 1 HOUR TIMEFRAME
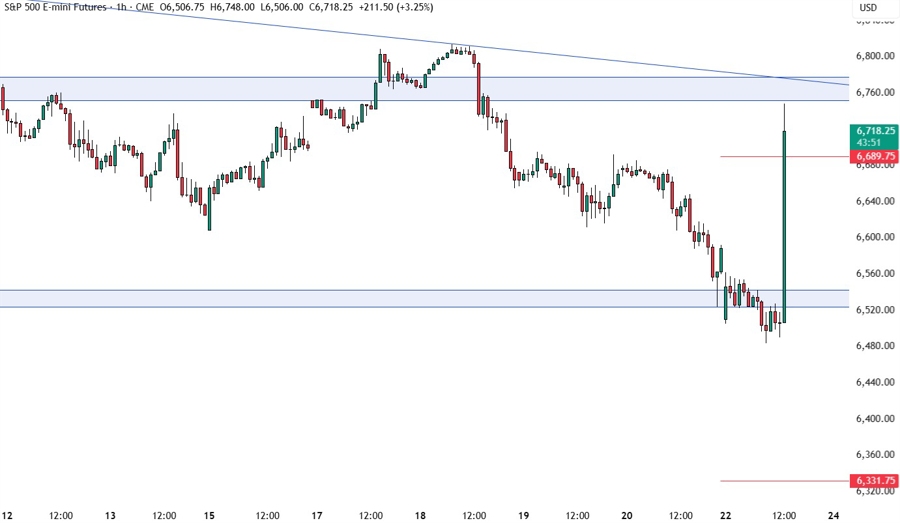
On the 1 hour chart, we can see that the price is trading much above the upper bound of the average daily range for today. This shouldn’t be surprising given the importance of Trump’s post. In such instances though, we can generally see some consolidation or a pullback before the next move.
UPCOMING CATALYSTS
Tomorrow we have the US PMIs. On Thursday, we get the latest US Jobless Claims figures. As a reminder, the focus is mainly on the US-Iran war, so keep an eye on the headlines.


