
FUNDAMENTAL OVERVIEW
The S&P 500 has been surprisingly resilient last week despite the surging oil prices and the global risk aversion. That resilience seems to have finally waned after oil prices surged into triple digit territory and the prospects of a quick end to the war dimmed.
The S&P 500 broke below the December lows today and opened the door for a retest of November lows around the 6,530 level. The longer this war drags on, the worse the consequences will be for the economy and the market as growth expectations would turn negative and the Fed would not be able to act fast amid the inflationary pressures from higher energy prices.
Traders continue to be laser focused on de-escalation as that would trigger a massive relief rally in the market. Trump said on Truth Social today that oil prices will drop rapidly when the destruction of the Iran nuclear threat is over. Reading between the lines, it looks like we are reaching Trump's pain threshold given the triple digit oil prices and weakening stock markets.
What a de-escalation could look like though? It could be Trump saying that the nuclear threat is over or that they reached all their goals in their military operation. That would mark the start of de-escalation, and the market will react to it quickly. The bias for now remains neutral to bearish.
S&P 500 TECHNICAL ANALYSIS – DAILY TIMEFRAME
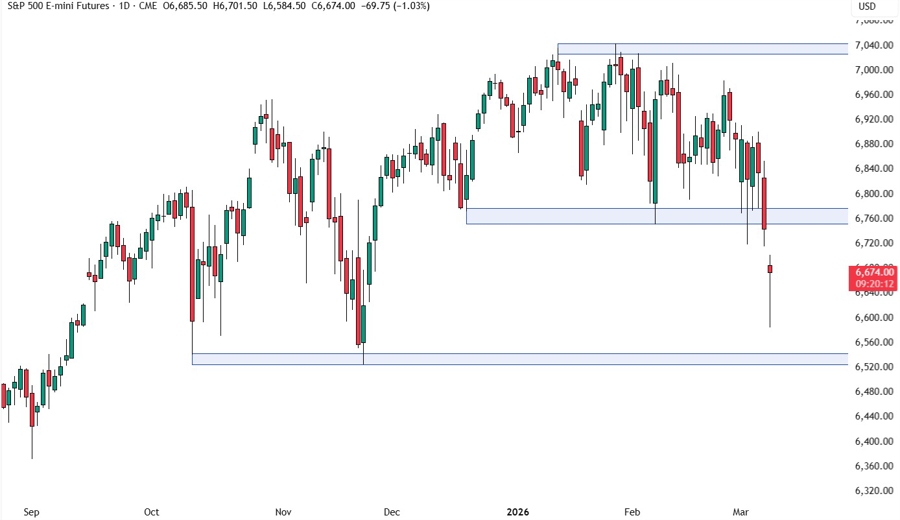
On the daily chart, we can see that the S&P 500 finally broke through the December lows and almost reached the November lows in the Asian session. If the price gets there, we can expect the buyers to step in with a defined risk below the 6,540 support to position for a rally into the 6,760 resistance. The sellers, on the other hand, will look for a break to increase the bearish bets into the 6,400 level next.
S&P 500 TECHNICAL ANALYSIS – 4 HOUR TIMEFRAME
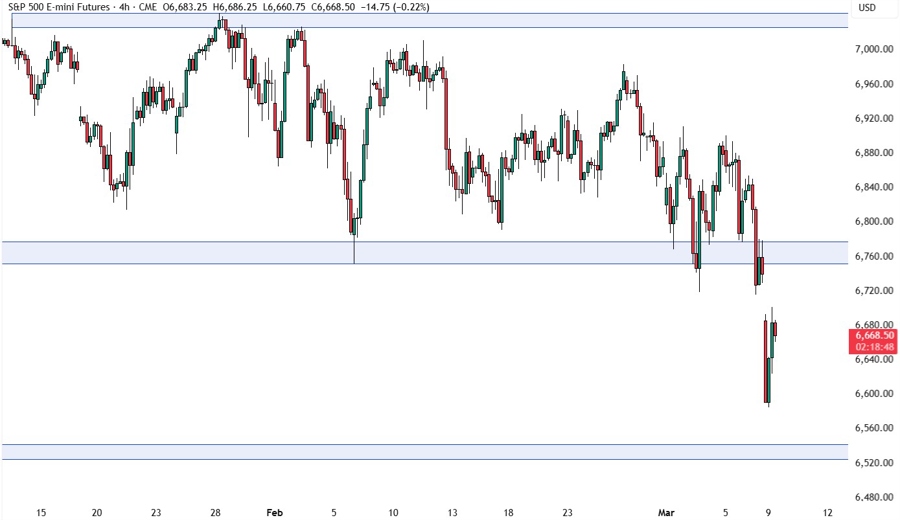
On the 4 hour chart, we can see the market opened lower today and extended the losses into the 6,585 level before pulling back. If we get a pullback into the resistance, we can expect the sellers to step in with a defined risk above it to position for a drop into the 6,540 support. The buyers, on the other hand, will look for a break to pile in for a rally into the 6,900 level next.
S&P 500 TECHNICAL ANALYSIS – 1 HOUR TIMEFRAME
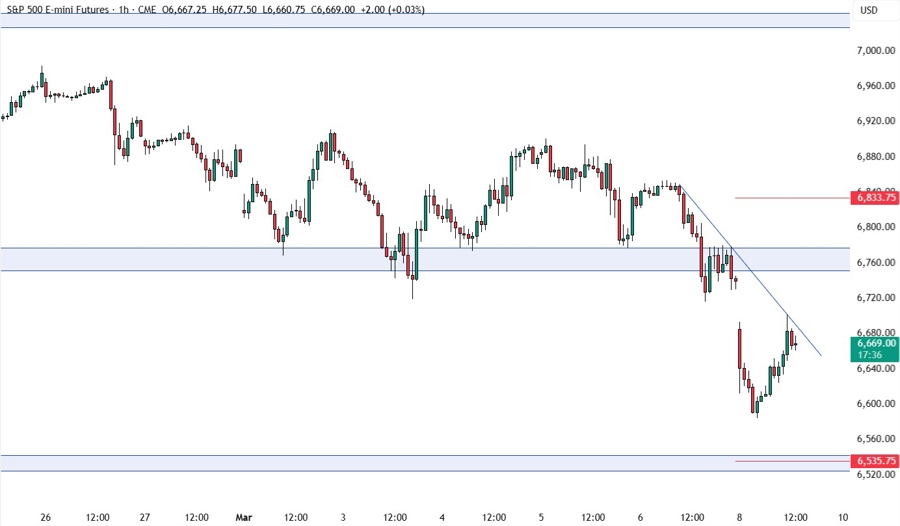
On the 1 hour chart, we have a minor downward trendline defining the bearish momentum on this timeframe. We can expect the sellers to lean on the trendline with a defined risk above it to keep pushing into new lows, while the buyers will look for a break to extend the pullback into the 6,760 resistance. The red lines define the average daily range for today.
UPCOMING CATALYSTS
On Wednesday we have the US CPI report. On Thursday, we get the latest US Jobless Claims figures. On Friday, we conclude the week with the US PCE price index, the University of Michigan Consumer Sentiment survey and the Job Openings data. As a reminder, the market focus right now is solely on the US-Iran war, so the data might not matter much.
