
FUNDAMENTAL OVERVIEW
The S&P 500 spiked into the 6,750 level following Trump’s ceasefire announcement on Monday but eventually gave back most of the gains after the Iranian side denied Trump’s claims and yesterday officially rejected the ceasefire proposal.
Overall, the market is now consolidating as Trump’s push towards a deal despite Iranian pushback, keeps the hope alive. Nonetheless, there’s a risk that this was just the usual jawboning strategy to calm markets while the US prepares of a ground invasion.
In fact, Trump’s announcement came right after the US stock indices were flirting with key downside breakouts, Treasury yields were surging into new highs and oil prices were rising into triple digit territory.
If the war escalates further and we get the news of a ground invasion, we will likely see the S&P 500 breaking into new lows. On the other hand, if Trump decides to pull back militarily and end the hostilities, we should get a strong relief rally which could mark the start of a move into new all-time highs.
For now, the risk of a ground invasion will keep the market under pressure and we will likely see defensive hedging into the weekend barring a surprising deal or end of the war.
S&P 500 TECHNICAL ANALYSIS – DAILY TIMEFRAME
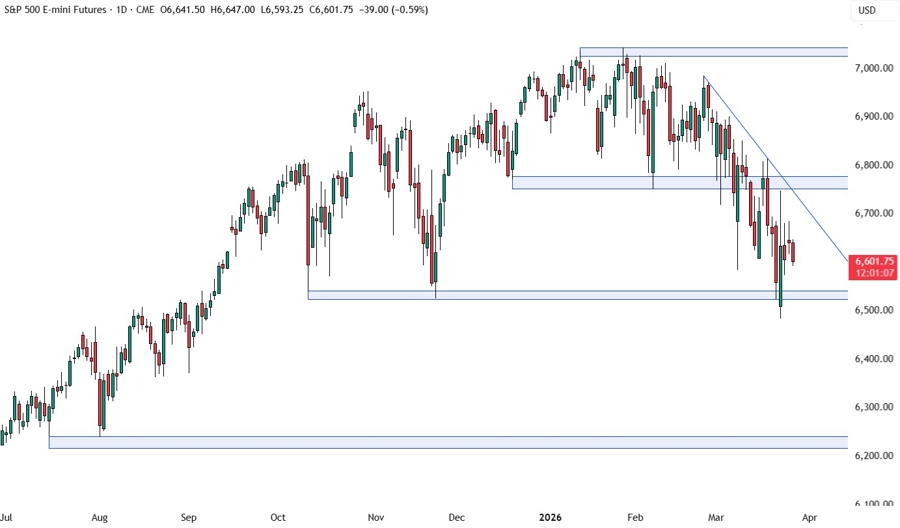
On the daily chart, we can see that the S&P 500 spiked into the 6,750 level where the sellers stepped in with a defined risk above the resistance to position for a drop back into the 6,525 support. If the price gets there, we can expect the buyers to pile in with a defined risk below the support to target a pullback into the downward trendline.
S&P 500 TECHNICAL ANALYSIS – 4 HOUR TIMEFRAME
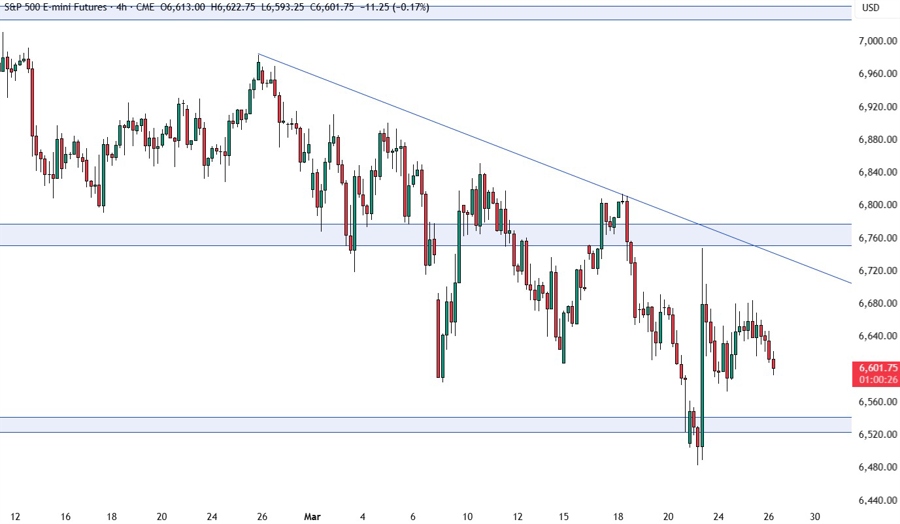
On the 4 hour chart, there’s not much we can add here as the price action became rangebound as traders are now waiting for new catalysts before picking a direction. We need to zoom in to see some more details.
S&P 500 TECHNICAL ANALYSIS – 1 HOUR TIMEFRAME
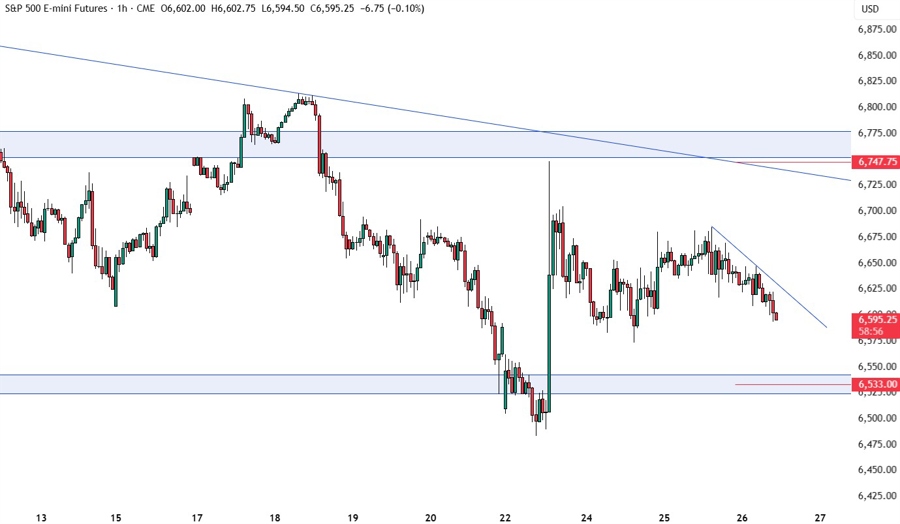
On the 1 hour chart, we have a minor downward trendline defining the current bearish momentum. We can expect the sellers to continue to lean on the trendline to keep pushing into the support. The buyers, on the other hand, will look for a break higher to target a rally back into the resistance. The red lines define average daily range for today.
UPCOMING CATALYSTS
Today we get the latest US Jobless Claims figures


