
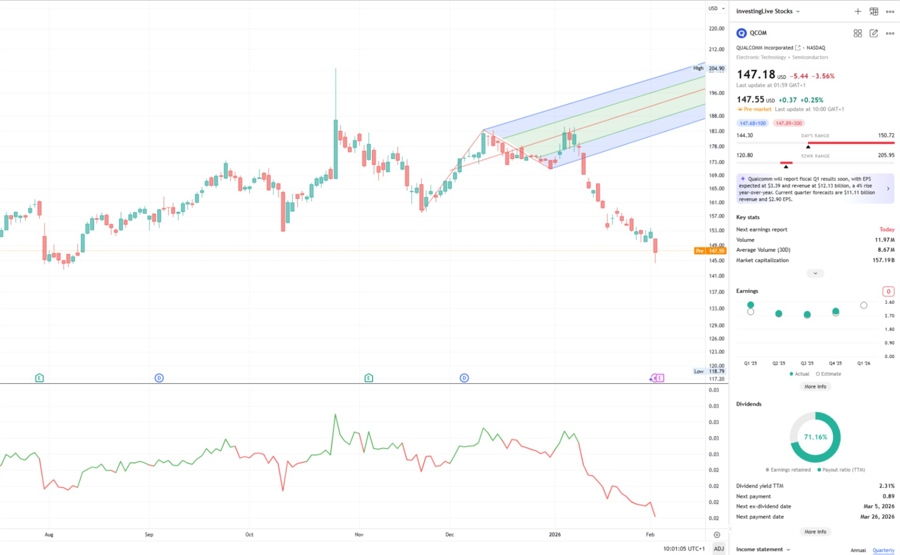
Market snapshot for QCOM before its earnings tonight
It’s been a whirlwind 24 hours for Wall Street as a big divergence hits US stocks, leaving many investors wondering if the long-awaited cyclical trade is finally back in season. The shift comes on the heels of what many are calling the worst day of the year in the Nasdaq, a session marked by high volatility that managed to make even Bitcoin look steady by comparison.
The tech sector remains under the microscope, especially as AMD shares fall on a disappointing AI outlook despite a solid earnings beat, highlighting just how high the bar has been set for artificial intelligence plays. As we move into the next trading session, all eyes are on the charts to see if tech shares face a key test or if this recent selloff is merely a healthy correction in a broader bull market.
Tonight, many stock investors are with their eyes on Alphabet and Qualcomm (QCOM) earnings.
QCOM shares are trading near the lower end of their post-earnings range as the market heads into the next earnings report, scheduled for Feb 04 after the market close.
Since the previous earnings release, QCOM has drifted meaningfully lower, reflecting a broader cooling phase across large-cap technology rather than a single, sharp negative catalyst. With earnings approaching, the key question for traders and investors is not just direction, but whether there is still a real edge going into the event.
The expected move into QCOM earnings (important context)
One useful reference ahead of earnings is the expected move, which is derived from options pricing, often referred to as the implied straddle.
For Qualcomm, the current implied move into earnings is about 6%.
A critical educational point for newer investors:
This is not a forecast
It does not imply bullish or bearish direction
It simply reflects how much the options market is pricing in movement either up or down
In other words, the market is saying that a roughly 6% move is plausible, but it has no conviction yet on direction.
What underlying activity suggests for QCOM earnings tonight
Recent market participation points to a subtle but important shift.
Selling pressure has remained present, but its effectiveness has declined. Over recent sessions, downside attempts have struggled to generate sustained follow-through. Instead of accelerating lower, price has repeatedly stalled and rotated.
From an educational standpoint, this matters because:
Strong trends require price to be accepted at new levels
When price stops progressing despite heavy participation, it often signals balance or absorption, not momentum
This does not indicate aggressive accumulation. It suggests that selling is no longer being freely accepted, which changes the risk profile going into earnings.
QCOM' stock analysis bottom line: The longer-term structure vs recent behavior
From a longer-term perspective, Qualcomm remains in a corrective phase that began after the prior earnings report. That structural damage has not yet been repaired.
However, recent behavior tells a more nuanced story. Over the past few weeks, price action has shifted from directional decline to overlapping, range-like trade. This reflects a transition from one-sided control toward uncertainty and balance.
When longer-term weakness meets short-term stabilization, conviction typically compresses rather than expands, especially ahead of major events like earnings.
Key price areas to watch
$146 to $148
Active stabilization zone. Holding above this area keeps the basing process intact.Below $146
Sustained acceptance below this level would suggest sellers have regained control.$150 to $152
Upside attempts that stall here would reinforce range behavior rather than signal a trend reversal.
These zones matter more than predictions heading into earnings.
Market bias score for QCOM earnings tonight and how to read it
Market bias score: -1 (slightly bearish, improving)
A brief explanation of the scale:
Scores range from -10 (very bearish) to +10 (very bullish)
Readings near zero indicate low edge and higher uncertainty
The closer the score is to zero, the less directional conviction the market is offering
A -1 score reflects lingering longer-term weakness, but also clear signs that downside pressure is losing efficiency. This is not a strong bearish setup, and it is not a bullish one either.
Technical Analysis for QCOM before Earnings: Qualcomm Breakdown
$QCOM Daily: Bear flag breakdown active; but oversold near
Bear Flag Confirmation: The stock recently broke out of a consolidation pattern that formed the "flag" portion of a bear flag. This breakdown below the lower support line typically signals a continuation of the prior downtrend.
Pitchfork Resistance: Using the Andrews’ Pitchfork, the price action struggled to reclaim the median line, eventually falling through the lower parallel. This confirms that the bears are firmly in control of the current channel.
Support Search: Since the breakdown, $QCOM$ has been searching for a floor, recently hovering near the $152 level. Continued weakness could lead to a test of the psychological $150 support zone.
Relative Strength Divergence: While the price remains weak, the Relative Strength vs. S&P 500 (SPX) indicator below the chart is beginning to flatten or curve while the price makes lower lows. This "bullish divergence" suggests that the selling pressure is reaching an exhaustion point relative to the broader market.
Educational Point: Price vs. Relative Strength
A key lesson here is the difference between absolute price and relative strength. A stock can be in a clear downtrend (absolute weakness) while its relative strength starts to bottom out. When a stock stops falling faster than the S&P 500, it often precedes a "mean reversion" rally. Traders watch for the RS line to turn upward as a "leading indicator" that the stock is becoming a value play for institutional buyers, even before the price chart officially turns bullish.
This Andrews' Pitchfork technical guide is useful because it explains how the median line of the fork acts as a magnet for price, which helps explain why the current breakdown away from that line is so significant for Qualcomm's trend.
What does this all mean for different types of Qualcomm stock investors before earnings tonight?
For those considering short positions
When the bias is near zero and the expected move is already priced around 6%, downside bets, especially via options, can become tricky. Even if price moves lower by a few percent, option premiums may already reflect much of that risk, potentially leading to poor reward-to-risk outcomes.
For those looking for long exposure
From an order flow perspective, there is no clear evidence of accumulation yet. This suggests that patience may be warranted, with a post-earnings reaction potentially offering clearer information than a pre-earnings bet.
For existing holders
Some investors may choose to continue holding through earnings, while others may consider taking partial profits to reduce exposure. Both approaches are valid depending on individual risk tolerance, especially given the lack of a strong edge in either direction.
A near-zero score typically means the trade lacks a clear advantage on both sides.
Important uncertainty reminder before any earnings!
No analysis can account for information that is not yet public. Earnings can introduce:
New company-specific data
Forward guidance surprises
Unexpected market reactions, regardless of fundamentals
Even when information is known, how other market participants respond is never guaranteed. This analysis represents one professional lens, not a complete picture.
Risk note for stock investors and traders
This analysis is intended for educational and decision-support purposes only. It is not financial advice. Markets are inherently uncertain, and all trading and investing decisions carry risk. Always conduct your own research and trade or invest at your own risk.
For real-time trade ideas, follow-ups, and market insights across stocks, indices, commodities, and crypto, check out the investingLive Stocks Telegram channel.
Trade ideas are shared for educational purposes only and at your own risk.


