
KEY POINTS:
- Fed's decision could weigh on global risk sentiment
- The price is trading below the key 25,900 resistance zone
- Near-term technical outlook more bearish
FUNDAMENTAL OVERVIEW
The Nifty 50 recently erased all the gains triggered by the RBI’s rate cut and extended the losses further after some key technical breaks.
Famous investor, Stanley Druckemiller, once said that if the price goes down on good news, it’s generally better to get out.
The recent weakness might have something to do with the Fed’s decision and traders leaning on the more defensive side.
The Fed is expected to deliver a “hawkish cut” today but the focus will be on how much hawkish it’s going to be.
If it’s more hawkish than expected, then we it will be negative for global risk sentiment and could negatively impact the Indian stock market too.
If the Fed comes out more dovish than expected, then it should boost the risk sentiment and support the stock market.
NIFTY 50 TECHNICAL ANALYSIS - DAILY TIMEFRAME
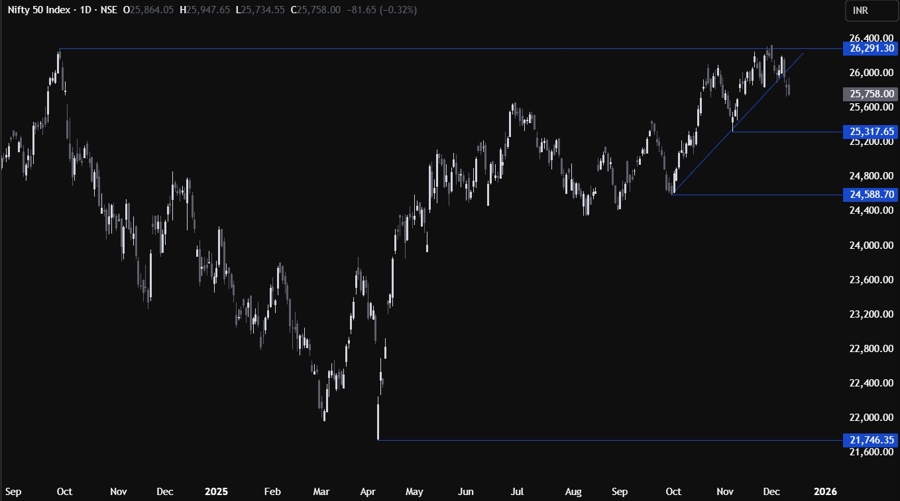
On the daily chart, we can see that the Nifty 50 broke below the trendline recently and extended the losses as more sellers piled in. This break opened the door for a deeper pullback into the 25,317 level which should be the main target for the sellers. If the price gets there, we can expect the buyers to step in with a defined risk below the 25,317 level to position for a rally into a new all-time high.
NIFTY 50 TECHNICAL ANALYSIS - 4 HOUR TIMEFRAME
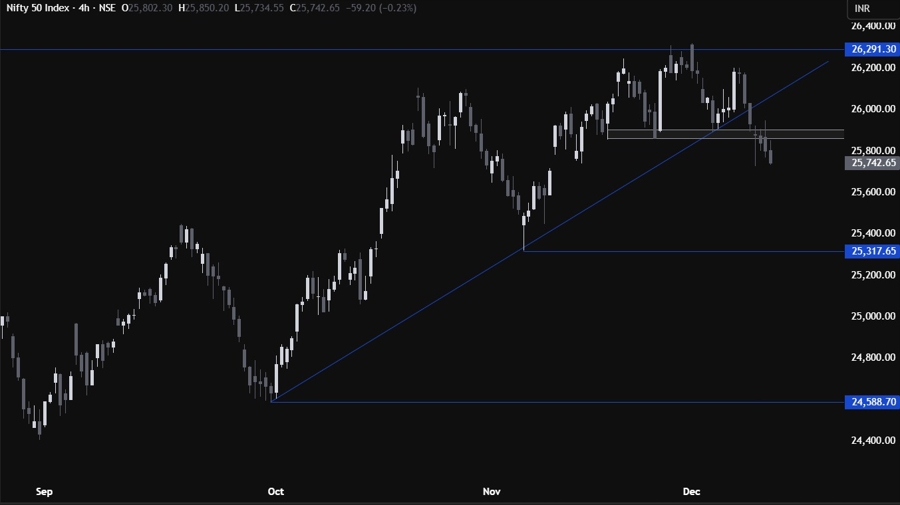
On the 4 hour chart, we can see that besides the trendline break, we’ve also got a break below the key 25,900 support zone. As long as the price stays below this zone, the bias should remain bearish into the 25,317 level. The buyers will need to see the price rising back above the 25,900 level to regain control and position for new highs.
NIFTY 50 TECHNICAL ANALYSIS - 1 HOUR TIMEFRAME
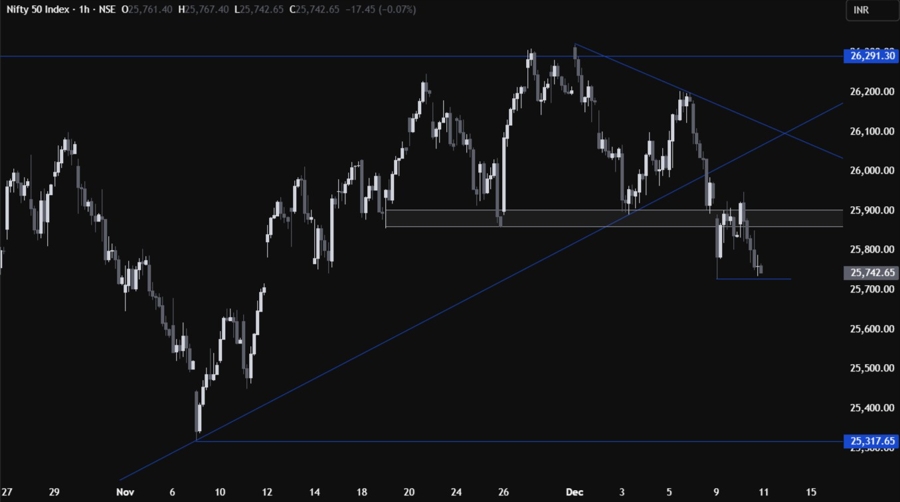
On the 1 hour chart, we can see that we got a retest of the support zone that now turned into resistance. If we get another pullback into the resistance, we can expect the sellers to step in there with a defined risk above it to keep pushing into the 25,317 level.
A break below the recent low at 25,725 should see more sellers piling in. On the other hand, if the price breaks above the resistance, we can expect the buyers to position for a rally into the downward trendline.
UPCOMING CATALYSTS
Today we have the FOMC rate decision. On Friday, we have Indian inflation report.
