Fundamental Overview
The soft NFP report on Friday was again faded completely by the stock market because of the focus on Fed rate cuts. In fact, the dovish bets on the Fed increased and the market is now expecting three rate cuts by year-end (68 bps).
Moreover, we have also an 8% probability of a 50 bps cut in September but that will likely happen only if we get a soft CPI report today. In that case, the stock market might get another boost to push into new all-time highs.
The bigger picture hasn’t changed much as the stock market continues to see better growth ahead despite all the doom and gloom coming from analysts and economists. The market doesn’t care about what has happened in the past quarters but how things are likely to evolve in the next quarters.
And those positive expectations are supported by the upcoming rate cuts and the fact that things are not as bad as people think. We just have a frozen labour market most likely due to the uncertainty created by Trump’s policies in the first half of the year. That is now behind us, and the rate cuts could spur growth and improve economic activity, which is a good thing for the stock market.
Nasdaq Technical Analysis – Daily Timeframe
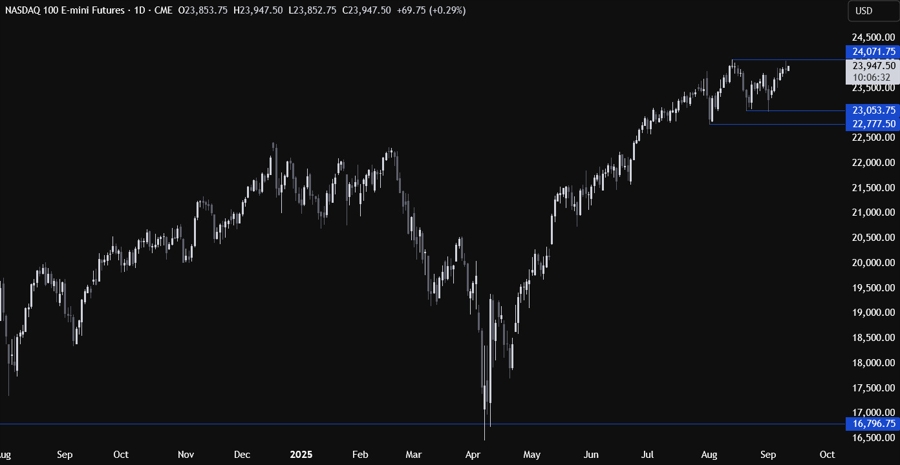
On the daily chart, we can see that the Nasdaq has been basically ranging for over a month, although the trend continued to be skewed to the upside. The price is now trading near the all-time highs and this is where we can expect the sellers to step in with a defined risk above the high to position for a drop into the 23,050 level. The buyers, on the other hand, will want to see the price breaking higher to increase the bullish bets into new highs and will look to buy the dip in case the price pulls back into the 23,050 level.
Nasdaq Technical Analysis – 4 hour Timeframe
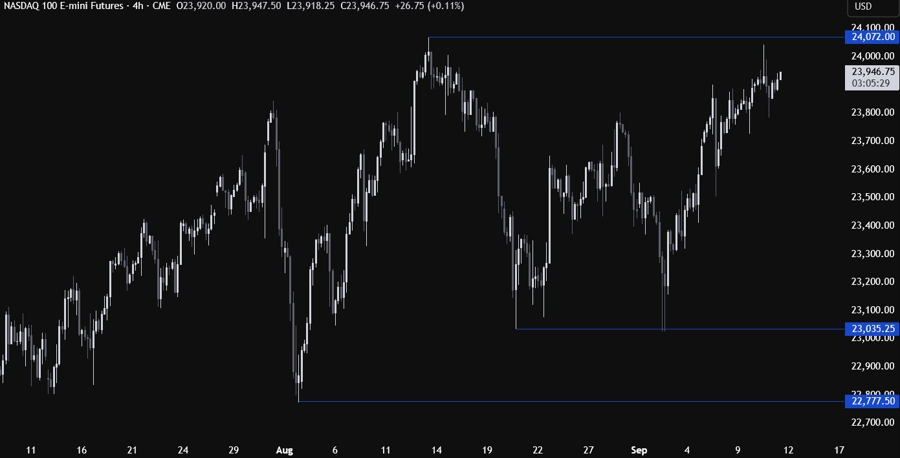
On the 4 hour chart, there’s not much we can glean from this timeframe as the price action inside ranges is generally choppy with no clear levels where to lean onto. We will need to zoom in to see some more details.
Nasdaq Technical Analysis – 1 hour Timeframe
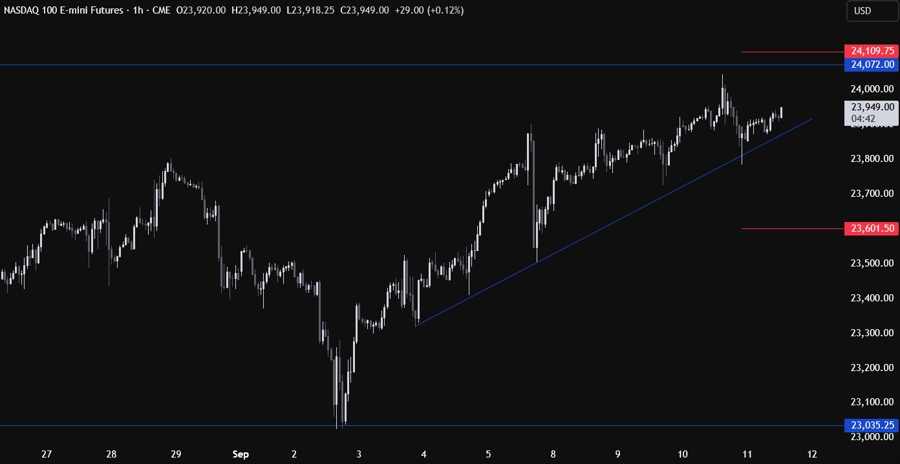
On the 1 hour chart, we can see that we have a minor upward trendline defining the bullish momentum on this timeframe. The buyers will likely continue to lean on it to keep pushing into new highs, while the sellers will look for a break lower to target a drop into the 23,050 level next. The red lines define the average daily range for today.
Upcoming Catalysts
Today we get the US CPI report and the latest US Jobless Claims figures. Tomorrow, we conclude the week with the University of Michigan Consumer Sentiment report.