
KEY POINTS:
- US CPI came out much softer than expected, potentially giving the Fed a reason to cut earlier than expected
- The Fed's dovish reaction function remains a tailwind for the stock market
- The Santa Claus rally might be starting, but traders will look for technical breaks to have more conviction
FUNDAMENTAL OVERVIEW
The US CPI yesterday surprised to the downside across the board, but as we’ve seen with the NFP report, the market took the data with a pinch of salt. The Nasdaq strengthened following the CPI release but eventually gave back some of the gains as the bullish momentum faded.
It should also be noted that we got the US Jobless Claims yesterday and the data was strong. The Initial Claims remain around the same low levels we got used to for years, but Continuing Claims dropped to the lowest level since May.
The main takeaway is that the recent data shows gradual cooling in the labour market, with inflation undershooting Fed’s forecasts. Fed Chair Powell made it pretty clear in his last press conference that they are more focused on the labour market weakness, and they can tolerate some higher inflation given the transitory expectations.
This suggests that we could see another rate cut sooner than expected, especially if the recent data gets validated next month. The market should start to move into that direction with new all-time highs likely being in the cards.
NASDAQ TECHNICAL ANALYSIS - DAILY TIMEFRAME
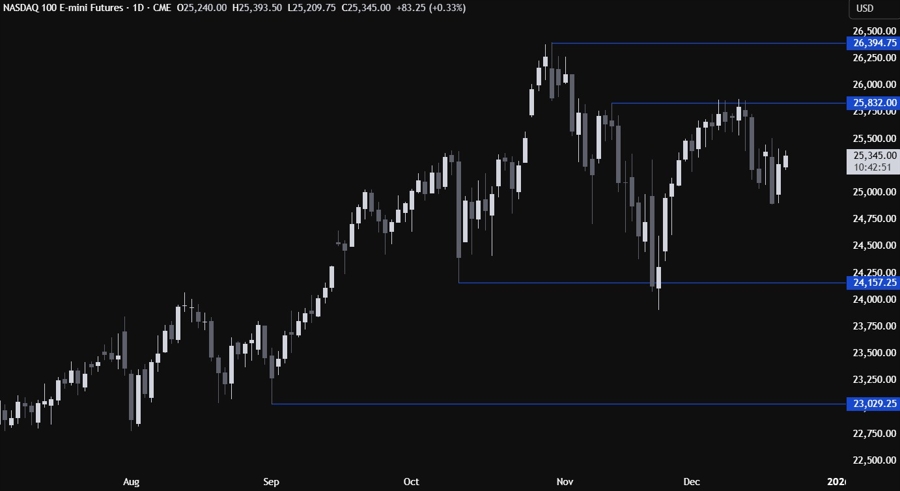
On the daily chart, we can see that the Nasdaq couldn’t break above the 25,832 level and eventually pulled back into the 25,000 price area. We’ve been consolidating this week, but the soft US data might provide enough support for the buyers to push to the price back towards the 25,832 level.
If we get there, we can expect the sellers to step in with a defined risk above the level to position for a drop into the October lows. The buyers, on the other hand, will look for a break higher to increase the bullish bets into the all-time highs.
NASDAQ TECHNICAL ANALYSIS - 4 HOUR TIMEFRAME
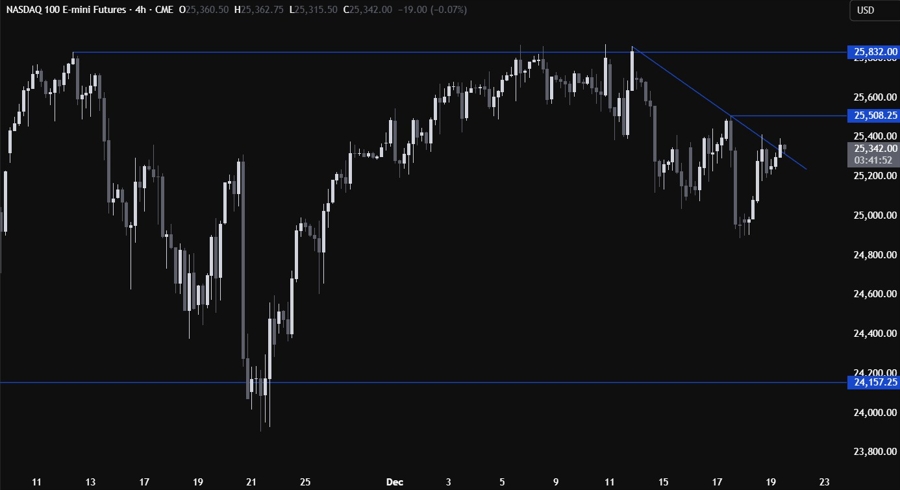
On the 4 hour chart, we can see that we have a downward trendline defining the recent pullback into the 25,000 price area. We got a rejection yesterday, but the price is now breaking above the trendline. The buyers will likely pile in here with a defined risk below the trendline to target the 25,832 level. The sellers, on the other hand, will want to see the price falling back below the trendline to pile back in and target new lows.
NASDAQ TECHNICAL ANALYSIS - 1 HOUR TIMEFRAME
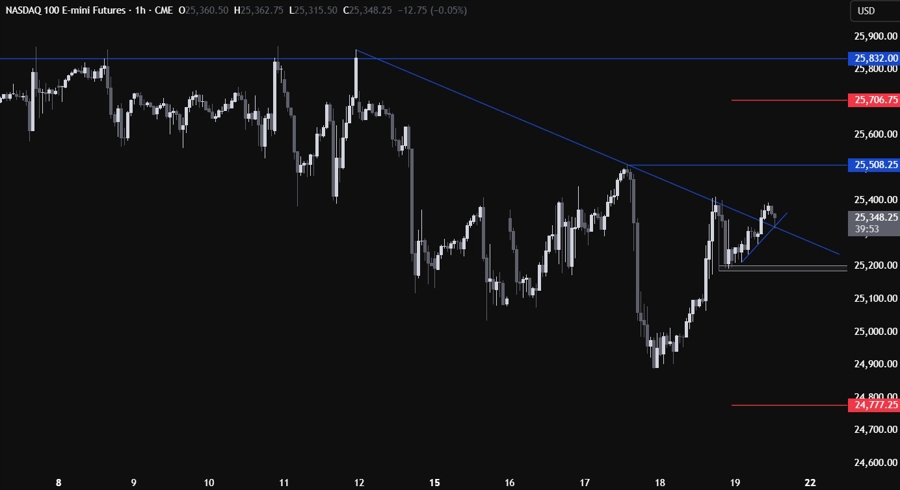
On the 1 hour chart, we can see that the price is rejecting the broken trendline and the minor upward trendline. This is where the buyers are stepping in to target the 25,508 level where a break will open the door for a move into the 25,832 level next. The sellers, on the other hand, will look for a move back below the trendline to pile in for a drop into the recent low around the 25,200 level to then target new lows on a further break. The red lines define the average daily range for today.


