
FUNDAMENTAL OVERVIEW
The Nasdaq opened lower yesterday after the US and Israel launched a coordinated attack over the weekend against various Iran’s targets that included key officials and military facilities. Their operation managed to kill Iran’s Supreme Leader Khamenei and many other regime officials.
Iran responded with broad attacks against Israel and US bases in various Gulf States like Jordan, Kuwait, Bahrain, Qatar, Iraq, Saudi Arabia, and the United Arab Emirates aimed at building pressure to end the war.
The strategy seemed like working as Bloomberg reported that UAE and Qatar were lobbying allies to persuade Trump to end Iran war soon. That and other de-escalation attempts helped the Nasdaq to erase losses, and the index eventually finished the day higher.
Unfortunately, late yesterday the advisor to the commander of IRGC said that the Strait of Hormuz was basically closed and they will target any ship that attempts to pass through. The traffic in the Strait has indeed fallen dramatically with minimal activity. The longer this war drags on, the worse the consequences will be for the global economy.
The stock market is at risk of a huge selloff if things deteriorate further as growth expectations would turn negative and the Fed would not be able to act fast amid the inflationary pressures from higher energy prices. The bias for now remains neutral to bearish, so the bulls will need to wait for clear de-escalation before piling back in.
NASDAQ TECHNICAL ANALYSIS – DAILY TIMEFRAME
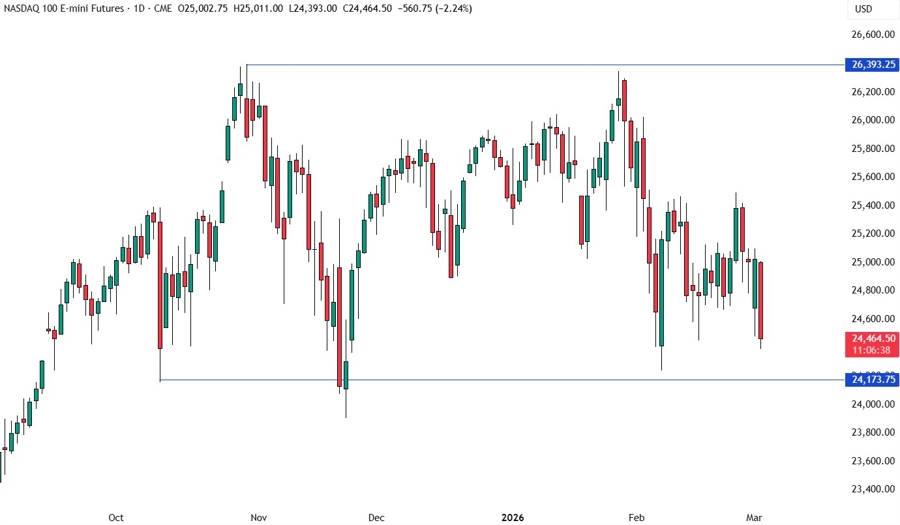
On the daily chart, we can see the Nasdaq has been trading in a wide range since October of last year. Such long consolidations generally lead to big trending moves once the price breaks out. Until then, the market participants will continue to play the range.
NASDAQ TECHNICAL ANALYSIS – 4 HOUR TIMEFRAME
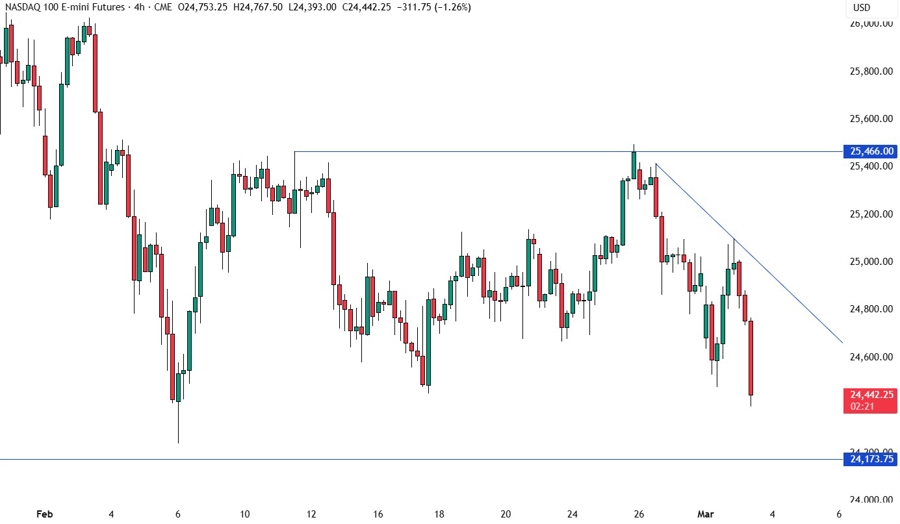
On the 4 hour chart, we have a tighter range between the 24,173 support and the 25,466 resistance. Again, market participants will continue to play the range by selling at resistance and buying at support until we get a breakout.
NASDAQ TECHNICAL ANALYSIS – 1 HOUR TIMEFRAME
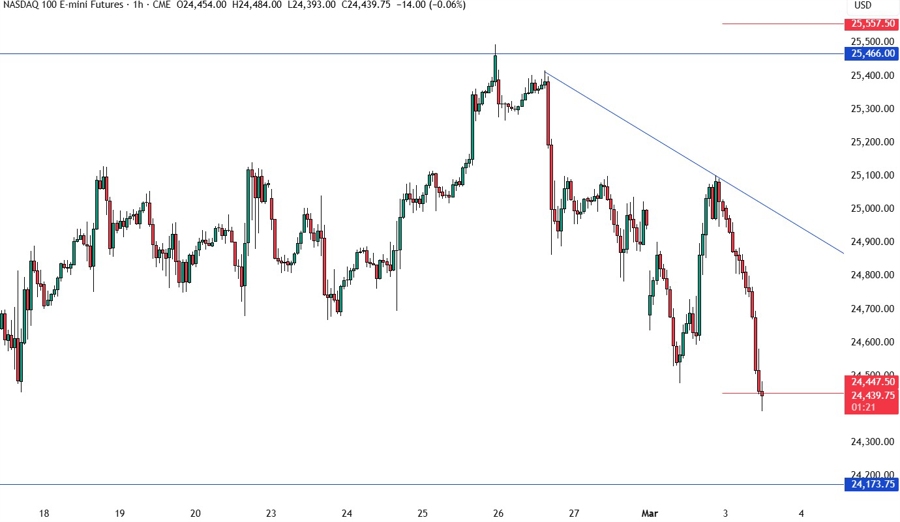
On the 1 hour chart, we can see the price is trading at the lower bound of the average daily range for today. In such instances, the price generally consolidates or pulls back before the next move. If we get a pullback into the downward trendline, we can expect the sellers to lean on it to keep pushing into new lows, while the buyers will look for a break higher to increase the bullish bets into the 25,466 resistance next.
UPCOMING CATALYSTS
Tomorrow we have the US ADP and the US ISM Services PMI. On Thursday, we get the latest US Jobless Claims figures. On Friday, we conclude the week with the US NFP report. The data might not matter much this week amid the US-Iran conflict.
