
The NASDAQ index moved higher earlier in today’s trading, climbing to a session high of 22,906. At that level, the price was testing the falling 200-hour moving average, a key technical resistance level. Sellers leaned against that moving average, and the failure to break above it reinforced the level as an important risk and bias-defining area for traders.
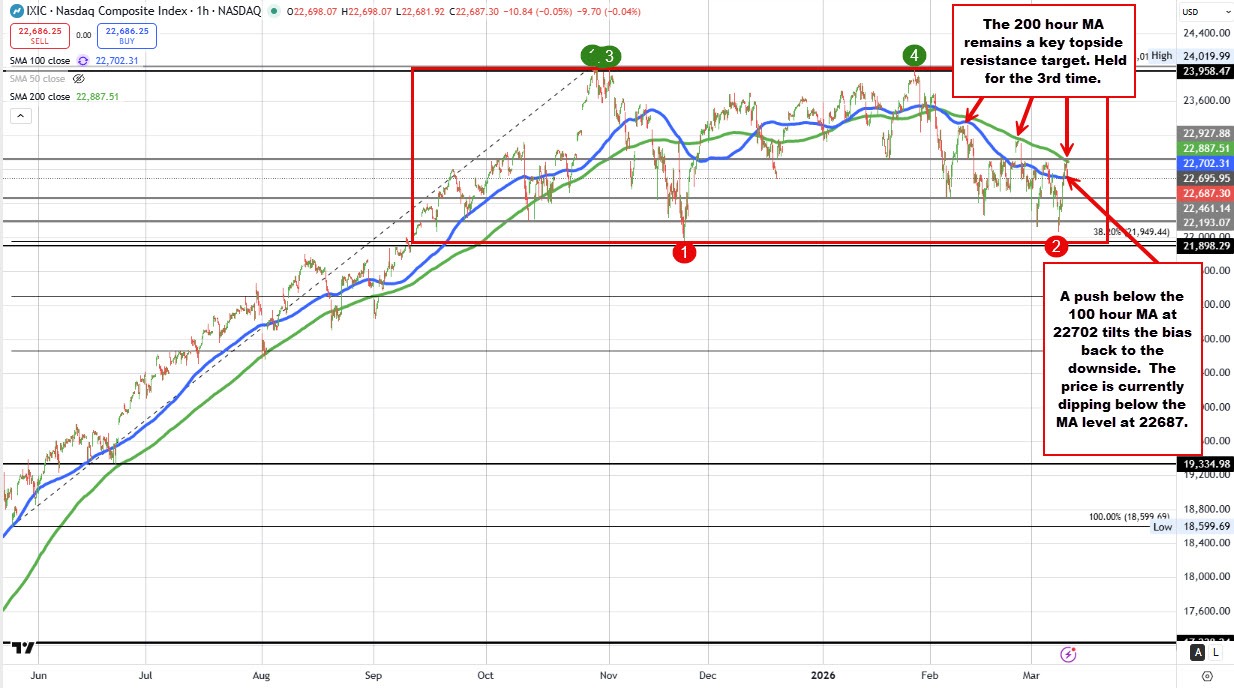
Headlines reporting that Iran may be placing mines in the Strait of Hormuz added to the shift in sentiment and helped push the index back to the downside. The inability to sustain a move above the 200-hour moving average keeps the near-term bias tilted to the downside, with that level continuing to act as a ceiling for the market.
The subsequent decline has now pushed the price below the lower 100-hour moving average, which currently comes in at 22,702.37. The index is presently trading near 22,693, down about 4 points (-0.01%) on the day.
If the price can maintain momentum below the 100-hour moving average (blue line on the chart above), seller control would increase, shifting the focus back toward the downside. Some support targets include 22461.14 and below that 22256.76..
Below that and the lower end of the broader trading range that has been in place since mid-September would be targeted. That area also aligns with the 38.2% retracement of the rally from the late-May low, making it an important technical target should downside pressure continue.
If buyers can dig in right here, that would keep the buyer in play with the 200 hour MA (green line on the chart above) continuing to be a key level that will need to be broken to give the buyers more control.
