
As we head into the close, the major US stock indices are pressing to new lows for the day and the week, with downside momentum building. The S&P 500 is down nearly 1.5%, while the NASDAQ has extended losses to around -2.0%, reflecting broad-based selling pressure.
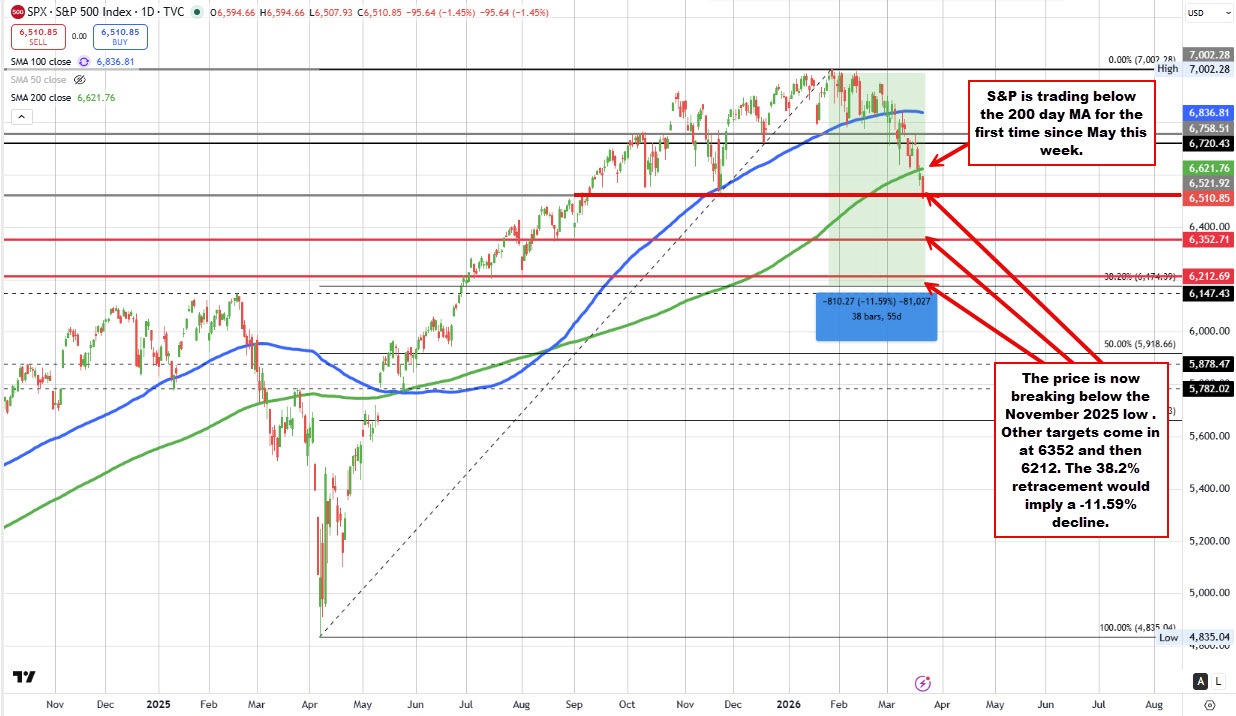
This week marks an important technical shift, as both indices have now moved below their 200-day moving averages (Green line on the chart below) for the first time since May 2025. That break weakens the longer-term bullish bias and suggests that sellers are gaining firmer control.
Focusing on the S&P 500, the index has now extended below the November low at 6521.92, taking out a key support level. With that break, the chart opens up, and there is limited support until the 6352 level, followed by a deeper target near 6212. Beyond that, the 38.2% retracement of the rally from the April 2025 low comes in at 6174.39, which represents a more significant correction zone.
If the price were to extend toward that retracement level, it would imply a decline of roughly 11.6% from the all-time high reached in January, highlighting the potential magnitude of the current correction if downside momentum persists.
Looking back to 2025, the move down from the February high to the April low took the price down -21.4%.
For the trading week, the S&P index is down -1.86%.
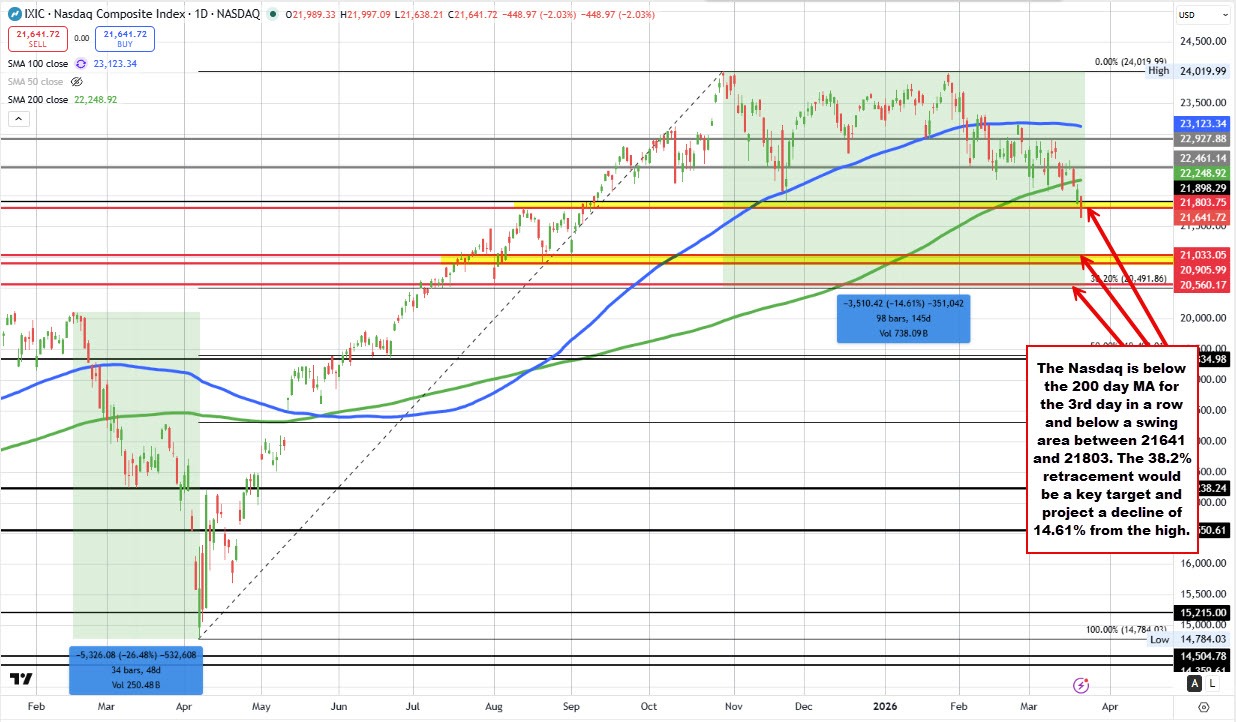
Likewise, the NASDAQ index has seen its technical tone shift more decisively to the downside. The index moved and closed back below its 200-day moving average on Wednesday, and since then, downside momentum has continued to build through both yesterday’s and today’s sessions.
The decline has now pushed the price below a key swing area between 21,641 and 21,803, increasing the bearish bias. Currently trading near 21,640, down about -2.04% on the day, the break of that support zone suggests sellers are maintaining control.
Looking ahead, the next downside target comes in between 20,905 and 21,033, which represents the next meaningful support region. A move below that zone would shift focus toward the 38.2% retracement of the rally from the April 2025 low, which comes in near 20,491.86.
A decline to that level would represent roughly a -14.6% drop from the all-time high, underscoring the scope of the current correction if momentum continues lower. For context, the prior trend move from the February 2025 high to the April 2025 low saw a much steeper decline of about -26.5%, highlighting that while the current move is significant, it has not yet reached the magnitude of previous corrections.
For the trading week, the NASDAQ index is down -2.04%.
War in Iran is about to enter its 4th week. Although Trump and the US insist the plan is ahead of schedule, there are still changes to the plan including taking over Kharg Island which suggests boots on the ground and an end to the war weeks - if not months away. Moreover, strategic targets could be under attack by Iran and any hits, could require years of rebuilding and threatens the supply/demand for oil globally
Crude oil is currently trading at $98.60, after a volatile week which saw the low price extend down to $91.45, and the high price reach $102.44. For the week the price is little changed. Recall last week, the high price reached all the way up to $119.48 before closing the week near $99.30


