
Before I jump into what the order flow at Nasdaq futures is showing so far today, let's briefly look at the most important development since the weekend:
Geopolitical Tension and Energy Markets
Global energy markets are in a state of high alert following the breakdown of ceasefire negotiations between the U.S. and Iran in Pakistan. The primary sticking point remained Iran’s nuclear activities, leading U.S. officials to leave the talks early. In response, U.S. President Trump reaffirmed a blockade on all maritime traffic entering and exiting Iranian ports, effective today.
This aggressive stance immediately impacted energy prices, as oil prices jumped back above $100 per barrel due to fears of sustained supply disruptions in the Strait of Hormuz.
Regional Security Threats
The situation has further deteriorated with Tehran issuing stern warnings to its neighbors and international shipping. Iranian officials stated there will be no security for Persian Gulf ports if their own maritime interests are compromised. Iran has characterized the U.S. blockade as "modern-day piracy" and has vowed to block any enemy-affiliated vessels from transiting the Strait, a move that threatens to trap global trade in what they described as "deadly whirlpools."
Market & Currency Reactions
The failure of diplomacy has sent ripples through other asset classes. While geopolitical instability often drives investors toward "safe havens," gold prices come under pressure following the initial shock, as the market recalibrates for a potentially prolonged conflict.
Simultaneously, currency analysts at Credit Agricole suggest it is not yet the start of a downtrend for the dollar, as the U.S. currency remains supported by its safe-haven status and the absence of more positive geopolitical news.
Global Economic Backdrop
Outside of the Middle East, other economic headwinds are emerging. In the East, data reveals that China’s new bank loans slowed further during the first quarter of the year. This slowdown highlights weak financing demand within the world’s second-largest economy, which continues to struggle with a housing slump and deflationary pressures, adding another layer of uncertainty to the global economic outlook.
Nasdaq futures technical analysis today: this still looks more like a reset than a full breakdown
Before the weekend shock, Nasdaq futures had been building a healthier short-term structure. Then the geopolitical setback knocked that structure lower in one sharp move.
What matters now is what happened next.
Instead of extending into a clear one-way selloff, Nasdaq futures began rebuilding value step by step. That is why the current read stays modestly constructive rather than outright bearish. A true bearish takeover usually keeps pushing lower after the first break. So far, that has not happened.
Market bias score: +2.5 (modestly bullish). Surprised? Well, that's what orderflow hints at.
A +2.5 score does not mean Nasdaq futures are in a fresh breakout. It means the market has shown enough buyer resilience after the weekend shock to avoid a bearish reading, but not enough strength yet to claim that bulls fully control the tape again.
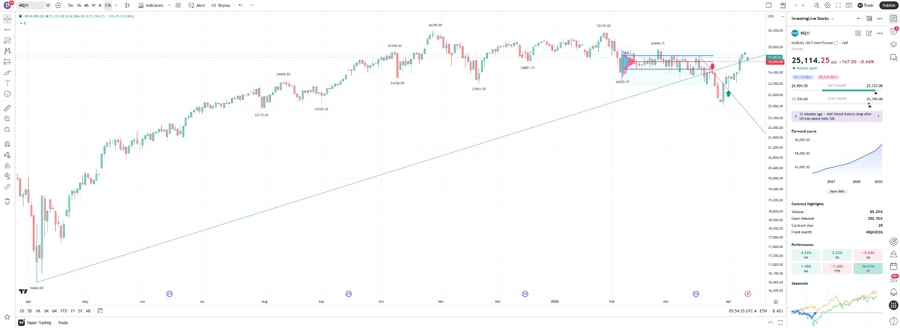
Think of the above Nasdaq futures 23hr bar chart (to show the "daily" but also with the afterhours... try that timeframe on your own, I think you will like that new perspective) chart like a giant game of "King of the Hill." Right now, the battle was and still is happening at 24,915 (current price is 100 points above but still "in the area").
Here is the simple breakdown of why that specific spot matters so much:
1. The Safety Net (The Green Line)
The green diagonal line is like a long-term safety net that has been catching the market every time it fell for months.
The Gap: Over the weekend, the price "jumped" off a cliff and landed right on this net.
The Result: So far, the net is holding. If the price falls through this line, it means the "big trend" is officially broken.
2. The High-Traffic Zone (The Red POC Line)
The red horizontal line at 24,915 is the Point of Control (POC).
Imagine a highway where everyone stops to get gas; that’s this price level. More trading happened here than anywhere else recently.
Because so many people bought or sold here in the past, they are "anchored" to this price. It acts like a floor because buyers feel it is a "fair price" and step in to stop the fall.
3. The "Line in the Sand"
This is the level where the Bulls (who want the price to go up) and the Bears (who want it to go down) are fighting for control.
| If Price Stays ABOVE 24,915 | If Price Drops BELOW 24,915 |
| Bulls Win: The "Safety Net" held. The market will likely try to climb back up and fill the gap. | Bears Win: The "Safety Net" snapped. This could lead to a much faster drop as people panic-sell. |
The market gapped down exactly to where the Green Net and the Red High-Traffic Zone meet. It’s the strongest support level on the chart. As long as we stay above it, the uptrend is technically still alive, but it's "breathing heavy."
Does this level feel like a solid place to look for a bounce, or are you worried about that red projection line pointing further down?
What the hourly Nasdaq futures action says now
The hourly sequence is one of the most encouraging parts of this Nasdaq futures setup.
After the weekend reset, the market briefly pushed into a lower shock zone, but sellers did not keep driving acceptance lower hour after hour. Instead, Nasdaq futures gradually rebuilt into higher short-term shelves. That tells us demand has been willing to absorb pullbacks, even though the recovery has not yet become aggressive.
For Nasdaq traders, that is an important distinction. This is not the behavior of a market that is fully breaking down. It is the behavior of a market trying to repair damage under a difficult macro headline.
What the latest 30-minute Nasdaq futures bar says
The latest 30-minute bar that just closed at 11:30 on Monday, 13 April 2026 (CEST) fits that same story.
Short-term selling pressure reappeared earlier, but the newest bar did not create fresh structural damage. Nasdaq futures held their main short-term support shelf instead of slipping back into the lower weekend reset zone. That keeps the near-term Nasdaq analysis tilted toward stabilization.
This does not prove a bullish breakout. It does suggest that sellers still have not converted the weekend news into a cleaner bearish trend.
Nasdaq futures levels to watch today
For today’s Nasdaq analysis, the first support zone is 25,062.5 to 25,112.5. That is the key short-term shelf Nasdaq futures have been trying to defend during the repair phase.
Below that, 24,962.5 remains the more important downside line. If Nasdaq futures begin accepting back below that area, the bearish case becomes much stronger.
On the upside, the first real reclaim zone is 25,237.5. Above that, the bigger overhead resistance area is 25,287.5 to 25,337.5. That is the zone bulls need to recover if they want to turn this Nasdaq futures bounce into a more convincing bullish Nasdaq move.
Bullish Nasdaq scenario today
The bullish Nasdaq scenario is straightforward.
As long as Nasdaq futures keep holding above the 25,062.5 to 25,112.5 support shelf, the current repair can continue. A sustained push above 25,237.5 would tell traders that this is becoming more than just a bounce. A firmer move into 25,287.5 to 25,337.5 would make today’s Nasdaq analysis materially more bullish.
In that case, the failed U.S.-Iran talks would increasingly look like a short-term shock that the Nasdaq absorbed, rather than the start of a deeper correction.
Bearish Nasdaq scenario today
The bearish Nasdaq scenario is also clear.
If Nasdaq futures fail below 25,237.5 or start losing 25,112.5 and 25,062.5 again, the current rebound would begin to look fragile. A move back below 24,962.5 would be the clearest sign that sellers are regaining control and that the weekend geopolitical stress is being translated into more lasting Nasdaq weakness.
For stock traders and investors, that would shift today’s Nasdaq analysis back toward neutral or slightly bearish.
Final Nasdaq outlook today
The best way to describe this market is simple:
Nasdaq futures are bending, not breaking.
The failed first round of U.S.-Iran talks created a negative macro backdrop, and Reuters reported that oil moved back above $100 while Wall Street futures, including Nasdaq 100 E-minis, fell early Monday. That is a real headwind for growth stocks and for broader Nasdaq sentiment.
But based on the 4-hour, hourly, and latest 30-minute Nasdaq futures action, the internal market response has been more resilient than the headlines suggest. That is why today’s Nasdaq analysis remains modestly bullish rather than bearish.
The main takeaway for Nasdaq traders and investors is this: the market has repaired enough to avoid a clean breakdown call, but it still needs one more clear reclaim above overhead resistance before resilience turns into real bullish control.
This analysis is intended for educational and decision-support purposes only. It is not financial advice. Markets are inherently uncertain, and all trading and investing decisions carry risk.
For real-time trade ideas, follow-ups, and market insights across stocks, indices, commodities, and crypto, check out the investingLive Stocks Telegram channel. Trade ideas are shared for educational purposes only and at your own risk


