Nasdaq futures have staged a rebound from the lows, but broader orderFlow context suggests this move remains corrective inside a bearish auction, rather than the start of a sustained bullish phase. But first, I dive into the bigger picture of the Nasdaq futures in my video below, enjpy:
---------
NASDAQ TRADER-UPDATE
08:05 ET – Monday, February 2
Nasdaq futures are showing increased selling participation as price trades near the upper junctions highlighted earlier. While this does not yet signal a reversal, it does mark a shift toward a more contested, two-sided environment.
Selling activity has picked up near these higher levels, suggesting sellers are actively testing demand rather than standing aside. So far, that pressure has not produced clear downside displacement, meaning buyers are still absorbing some of the supply.
This raises the bar for further upside continuation.
Key levels remain in focus
$25,525 and $25,600 remain the next upside reaction zones if price continues higher.
$25,485 is still the key downside reference. A move back below this level would signal a return into today’s value area.
The $25,500 round number remains an important pivot, even after being crossed, as it often regains influence later in the session.
What to watch next
Whether selling pressure begins to push price lower, not just slow it down.
Whether price can hold above $25,485 despite heavier participation.
How price reacts around $25,500–$25,525 as the session develops.
For now, the market is more contested, not decisively bearish.
Trade at your own risk.
----------------------------------------
NASDAQ TRADER-UPDATE: Price pushes higher, but key junctions remain in play
Nasdaq futures are extending higher this morning, with price now crossing above the $25,485 value area high from earlier in the session. That move confirms that bulls are currently in control of the short-term auction, lifting price out of balance rather than rejecting it.
That said, this advance is still unfolding inside a decision-heavy environment, where participation and follow-through, not momentum alone, will determine what comes next.
What order flow is showing beneath the move
As price pushed higher, activity increased rather than dried up. Recent price action reflects healthy participation, suggesting this move is not a low-liquidity drift. Both buyers and sellers are actively engaging at these higher levels.
Importantly, selling attempts have not yet translated into downside displacement. Periods of mixed or negative pressure have struggled to push price meaningfully lower, which points to absorption rather than aggressive bearish initiative.
At the same time, upside progress has been measured rather than impulsive. This tells us the market is still working inventory higher, rather than breaking into a runaway trend.
In simple terms, the market is advancing, but it is still deciding, not concluding.
Key levels that matter from here on Nasdaa futures
As price continues higher, attention shifts to new reaction zones, while earlier levels remain highly relevant if price rotates back down.
Upside reaction levels to watch
$25,525 – First area where participation may shift as price stretches higher.
$25,600 – A later junction to monitor for potential hesitation or reaction if the move continues.
Key downside reference points
$25,485 – Former value area high. A reversal back below this level would signal a return into today’s value.
$25,500 round number – Still a major reference. Even after being crossed, round numbers often regain influence later in the session as algorithms reassess positioning.
An important reminder for Nasdaq futures traders
Markets do not forget important junctions simply because price temporarily moves away from them.
Even if price behaves differently than initially anticipated, key levels retain their pull power. Larger participants and algorithms often re-engage these areas later in the day, sometimes hours after they first come into focus.
This is why professional traders keep prior value highs, round numbers, and high-participation zones on their radar throughout the session.
The game keeps moving, but the map stays relevant.
What to watch next
Whether price can hold above $25,485 without slipping back into value.
How price behaves as it approaches $25,525 and later $25,600.
Whether selling pressure eventually produces real displacement, or continues to be absorbed.
For now, bulls have the upper hand, but this remains a reaction-driven environment, not one to trade on assumptions.
Trade at your own risk.
--------------
Video walkthrough: Key Nasdaq futures levels and why they matter
In today’s video update, I walk through the Nasdaq futures structure using higher-timeframe reference points to explain why short-term rebounds still need to be treated with caution.
The analysis starts with a major pivot low from late December, which continues to act as a structural anchor for the current market phase. From that low, an anchored VWAP has been plotted, shown on the chart as a purple line. That anchored VWAP is currently acting as resistance, not support.
This distinction matters. On Friday, price was trading very close to that anchored VWAP from below, and today it remains a key line in the sand. If price were to retrace toward it from below and fail, it would reinforce the idea that sellers still have the upper hand.
One level highlighted in particular is $25,536, which sits just below that anchored VWAP and coincides with a prior structural low. This zone acts as a reference point for assessing the strength of any rebound. If price cannot even retrace toward that area, it suggests sellers remain aggressive and are not allowing buyers much room to rebuild momentum.
Another important reference is a declining red trend line that has acted as support on multiple prior occasions. Despite the recent bounce, that line has not yet been retested, which increases the odds that price may still rotate lower to test it before any broader recovery can be trusted.
From an order flow perspective, the video emphasizes that short-term rebounds do not automatically invalidate bearish control. While lower timeframes may show temporary strength, broader order flow still suggests sellers are slightly stronger than buyers so far today.
The analysis then shifts to Friday’s session structure. Friday’s value area low sits near $25,631, a level that becomes relevant if price continues higher. This is not just another random number. It represents an area where volume previously concentrated, meaning algorithms and larger participants often pay attention there.
For traders, this has practical implications. If price approaches that zone during a rebound, it can be a logical area to reduce exposure or take partial profits, as two-way trade and hesitation are common around such levels.
Above that, the video highlights Friday’s point of control near $25,720, along with Friday’s VWAP in the same general area. When multiple reference levels cluster together, they form what can be thought of as decision junctions, zones where the market often pauses to reassess direction.
Another level discussed is the first upper standard deviation of the anchored VWAP, near $25,900. This sits well above current price and represents a further junction that would only come into play if buyers prove stronger than currently anticipated.
Finally, I introduce a modified pitchfork and trend structure to provide context, showing how price has been moving between key reference zones rather than trending freely. This reinforces a core takeaway for traders: price is being guided by risk management decisions from larger participants, not by random candle patterns.
Okay, now, what about the Nasdaq order flow analysis for today so far? While short-term candles and momentum indicators may look constructive, the underlying order flow tells a more nuanced story.
What orderFlow at Nasdaq Futures Today is showing beneath the surface
Higher-timeframe value remains lower.
On larger range-based orderFlow views, value has migrated down and has not been reclaimed. This tells us the market is still accepting lower prices, even as short-term buying appears.VWAP is still acting as a ceiling, not support.
Price has tested into the VWAP zone but has not built acceptance above it. In orderFlow terms, that signals responsive buying, not initiative control.Recent buying was absorbed, not extended.
Earlier selling pressure stopped pushing price lower, which allowed a bounce. However, that bounce failed to convert into sustained upside acceptance. This is typical of inventory adjustment, not a regime change.Selling pressure returns near structure.
As price moved higher, sellers re-engaged near prior value and VWAP, indicating that larger participants are still using rallies to distribute risk rather than chase higher prices.
In short, the market is balancing short-term buying against higher-timeframe selling control.
The key price levels that change the story for Nasdaq Futures Today
Bullish threshold
Sustained acceptance above $25,500 (less likely)
If price can hold above this level and build value there, it would signal that buyers are no longer just absorbing pressure, but actually taking control of the auction. That would materially change the outlook.
Bearish threshold
Acceptance back below $25,400 (more likely)
A move back below this level, especially with follow-through, reinforces the view that the recent rally was corrective. In that case, downside risk reasserts toward lower value zones.
How to think about this environment for today's Nasdaq analysis
This is not a market that rewards chasing candles or relying solely on indicators. OrderFlow shows a sell-the-rally structure, where short-term strength must prove itself at key acceptance levels before it can be trusted.
Until the bullish threshold is reclaimed and held, rallies remain vulnerable. Until the bearish threshold breaks decisively, expect tactical noise rather than straight-line continuation.
Trade at your own risk.
For more real-time trader updates, trade ideas, and orderFlow-driven insights, join our free Telegram channel:
https://t.me/investingLiveStocks
Update on Nasdaq Future Live: Watching acceptance and buyer commitment near value highs
As price continued to grind higher, Nasdaq futures reached the upper edge of the developing value area, a dynamic zone that has been recalculating as activity increased.
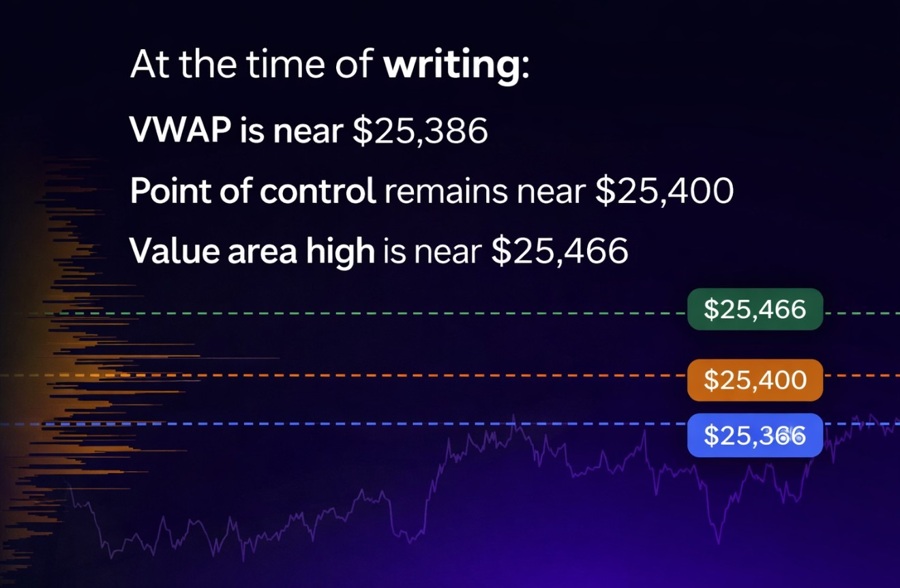
At the time of writing:
VWAP is near $25,386
Point of control remains near $25,400
Value area high is near $25,466
Rather than being rejected sharply, price has been leaning into this zone, which already tells us something important. Markets that intend to reverse lower usually do so quickly from value highs. Grinding behavior instead signals that inventory is still being worked through.
However, the most recent order flow adds an important layer of nuance.
A notable bar formed shortly after the round-hour window, with elevated volume relative to surrounding bars, while price held firm near the value area high. That kind of activity often reflects larger participants actively engaging liquidity rather than price moving on low participation.
What followed is equally important.
Subsequent bars failed to extend higher and instead opened back below the value area high and below recent high-volume zones, with buying pressure becoming less visible. This does not yet constitute a rejection, but it does introduce a pause in buyer commitment.
In other words, the market accepted higher prices, but now needs to prove it still wants them.
Why this matters (an educational note for Nasdaq futures traders)
This sequence highlights a key concept that many traders miss:
High volume alone is not bullish or bearish
What matters is what price does after that volume appears
When heavy activity shows up near a key level and price does not move away decisively, it often means one side is absorbing the other. The next few bars then become critical, because they reveal whether that absorption turns into continuation or simply exhausts participation.
Another important takeaway is the role of value area highs.
Value highs are not static resistance lines. When price grinds into them and value recalculates upward, it means the market is attempting to accept higher prices. Failure here tends to show up not as an immediate collapse, but as loss of upside follow-through, often before price visibly turns lower.
This is why professional traders focus less on single candles and more on sequences and behavior around key reference zones.
What we are monitoring from here
Whether price can reclaim and hold above the value area high
Whether buying pressure reappears on pullbacks rather than fading
Or whether continued hesitation near value leads to rotation back into balance
At this stage, the market is still deciding. There is no confirmed breakout, but also no confirmed rejection.
So, Nasdaq futures traders...
The broader view remains unchanged: this is a corrective rally inside a larger bearish auction, and rallies still need to prove themselves.
The new development adds an important refinement:
Buyers have pushed price higher
But they now need to recommit near value highs to avoid rotation
Until that happens, traders should remain selective, patient, and aware that acceptance matters more than momentary price spikes.
For ongoing real-time updates and orderFlow-driven insights like this, join our free Telegram channel:
https://t.me/investingLiveStocks
We focus on helping traders understand why markets behave the way they do, not just what the candles show.